HARDI Forecasting 2016
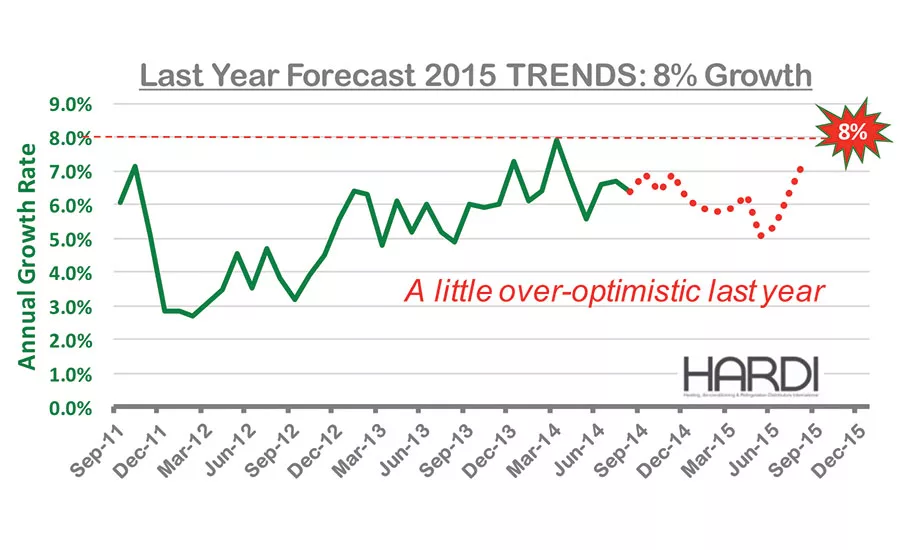

Forecasters are generally optimistic sorts. We are naturally bright-siders and more likely to err on the border of being too optimistic. Our kids are always the most talented ones on the field and, our dog is the best, but to tell you the truth, not really the smartest. As usual, our glass was more than half full at the Sidetrack Tap Saloon in Lake Wobegon when Distribution Center found us last autumn and asked us to write a forecast article for 2015. At the time, the annualized sales growth for HARDI distributors had been steady in the 6.5 percent range and, like us, it showed no intention of moving from where we were at; the annual growth rate had exceeded 7 percent only three times during the prior 36 months. Ever the optimist, I channeled my inner Cubs Fan and forecast “the average growth rate will improve during 2015 and will likely exceed 8 percent during the back half of 2015.”
The last time TRENDS sales growth was in 8 percent territory was June 2011. That healthy pace was a result of being compared with an abysmal prior year. June 2011 only looked that strong by comparison. 2015 did not have that benefit and, as of this writing, my forecast for the year looks a bit optimistic. But the Cubs did almost make it to the World Series, and the TRENDS annual growth rate did accomplish that rare achievement of exceeding 7 percent. Maybe 2016 is the year we return to 8 percent growth territory, but probably not.
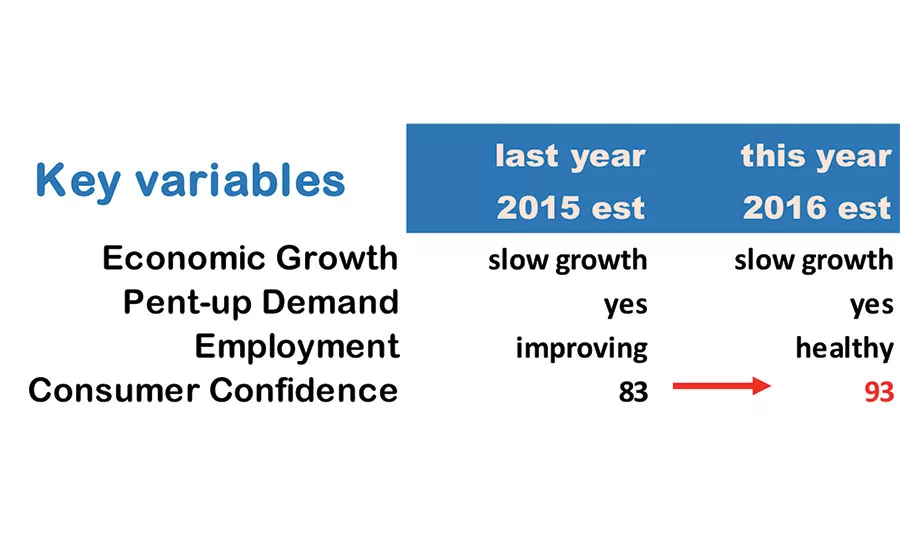
Here we are a year later, and not much has changed. The key indicators for industry growth remain healthy. Our favorite indicator, Consumer Confidence, has moved higher, residential real estate values are solid and the majority of the installed base is a year older. The favorable environment for HVACR sales persists.
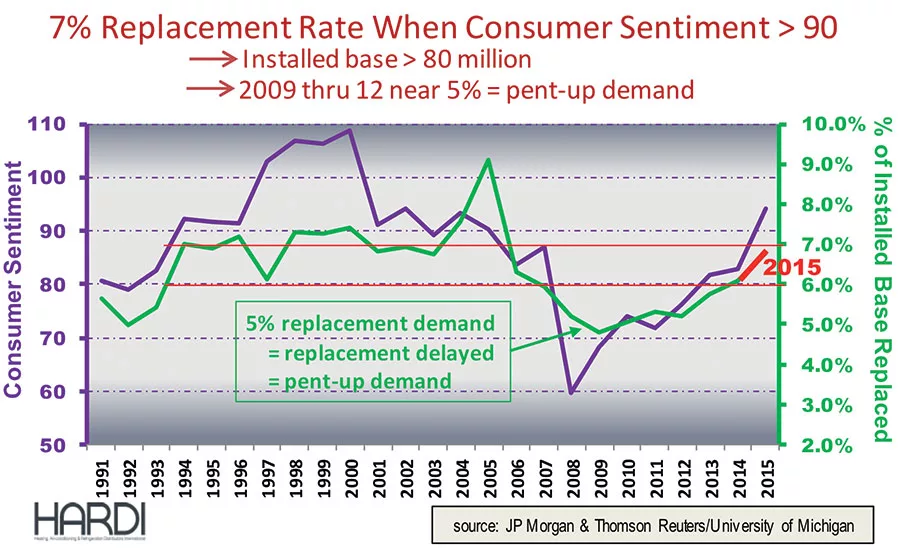
Repair and replacement of the installed base is the recurring revenue stream that will represent the majority of industry sales in 2016. Stephen Tusa of J.P. Morgan has done a remarkable historical analysis of residential replacement market activity. During the 10 years before The Great Recession, roughly 7 percent of the installed base would be replaced each year. That is consistent with a life span of 14 years and estimates by industry veterans. Replacement activity dipped to the midsingle-digit territory from 2009 to 2012 and has been slow to recover. That persistent shortfall from 7 percent is the basis for the “pent-up demand” theory and an important factor in our forecast last year: “If the historic relationship persists as we expect, then replacement activity will improve to at least 6.5 percent of the installed base as consumer confidence approaches the mid-80s.” Below, you see an update of the graph we included last year, illustrating this relationship.
Replacement demand did recover to nearly 7 percent of the installed base in 2015. Consumer confidence has continued to improve and is a positive indicator for 2016, but as the prior year approaches normal levels, so will the growth rate. The other major variable for 2016 will be new construction.
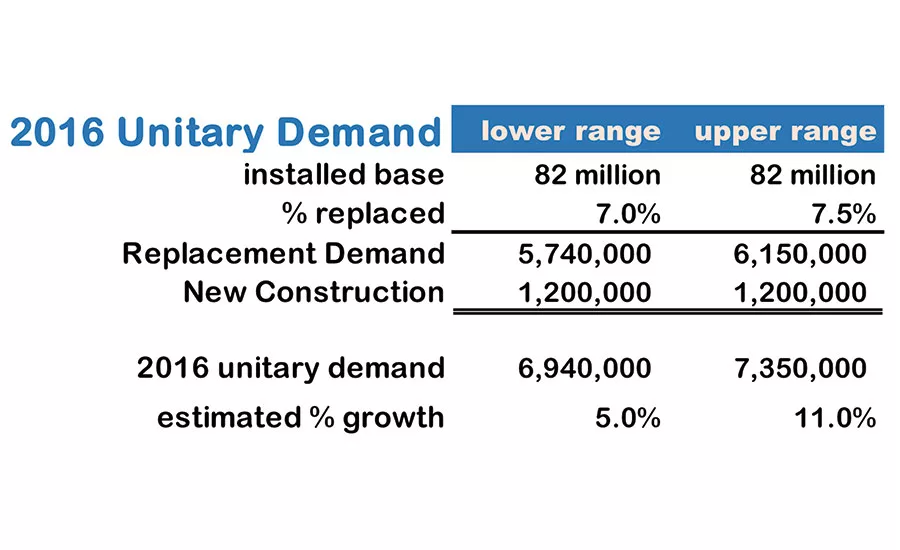
New construction is generally 15 percent of industry demand. It is not the main component of the top line but can be a major component of the annual variability. Based on economists’ estimates and the latest permit data, we are comfortable with nearly 10 percent demand growth from 1.1 million units in 2015 for new construction in 2016. So 2016 unitary demand could be summarized as follows:
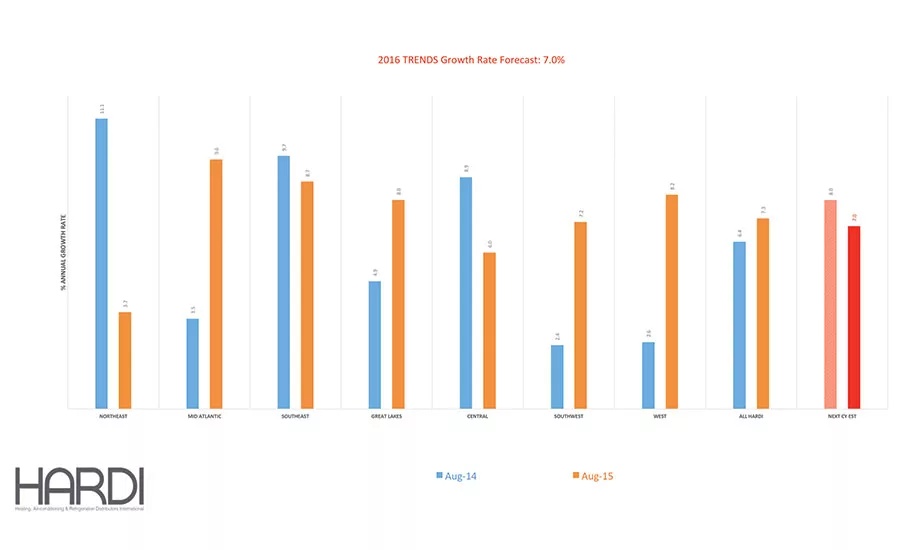
Growth rate is a function of the base year, and that was a factor for our 8 percent growth estimate for 2015. Large portions of the country had experienced slow growth in 2014. If the West and Southwest had rebounded this year like the mid-Atlantic, then we would be close to achieving that 8 percent forecast. The following are some of the related variables that could influence industry sales in 2016:
I have not seen any data or forecasts for accelerating economic growth in 2016. We will compare slow and steady improvement in 2016 against high single-digit sales growth in many of the regions, resulting in a slightly slower forecast but still an optimistic outlook. I expect TRENDS sales growth for 2016 to be 7.0 percent and hope I am not being too optimistic. It is too soon to talk about the Cubs.
When you watch the weather report, do you pay more attention to the national picture or your location? Members appreciate the TRENDS report throughout the year because it captures the variation across the various regions. The Central region stretches from Wisconsin to Utah and North Dakota to Kansas. It is a big region, but weather affects regions like that. It was wet and cool during May 2015, and the average distributor in the Central region reported a sales decline of 12.8 percent. The local market conditions are necessary to help distributors understand their performance. At the end of 2016, some regions will have experienced sales growth greater than 7 percent, and others will wish they achieved 7 percent.
Looking for quick answers on air conditioning, heating and refrigeration topics? Try Ask ACHR NEWS, our new smart AI search tool. Ask ACHR NEWS
The Northeast will experience double-digit sales growth in 2016. New construction activity is typically the primary variable for year-to-year growth. Based on current permit levels, new construction in the Northeast will increase by nearly 50 percent due to unusual activity in New York state. When compared with a soft 2015, the Northeast will produce double-digit TRENDS sales growth in 2016.
Sales growth in the Great Lakes region lagged the national average for five of the past six years. After the relatively strong performance in 2015, next year probably will return to mid-single-digit territory at best. Active permit activity in Michigan will not be enough to offset declines in Ohio and Indiana.
Looking for a reprint of this article?
From high-res PDFs to custom plaques, order your copy today!


