2018 Forecast: The HARDI Perspective

The economic environment for HVACR demand seems to be very good. Consumer confidence is high, and stories of homes selling quickly are common. Employment growth persists, and wages are improving. This Goldilocks scenario is very similar to the high points from last year when we were preparing the forecast. We thought the pent-up demand thesis still had some validity, but there would be a difficult comparison after the 2016 heat wave.
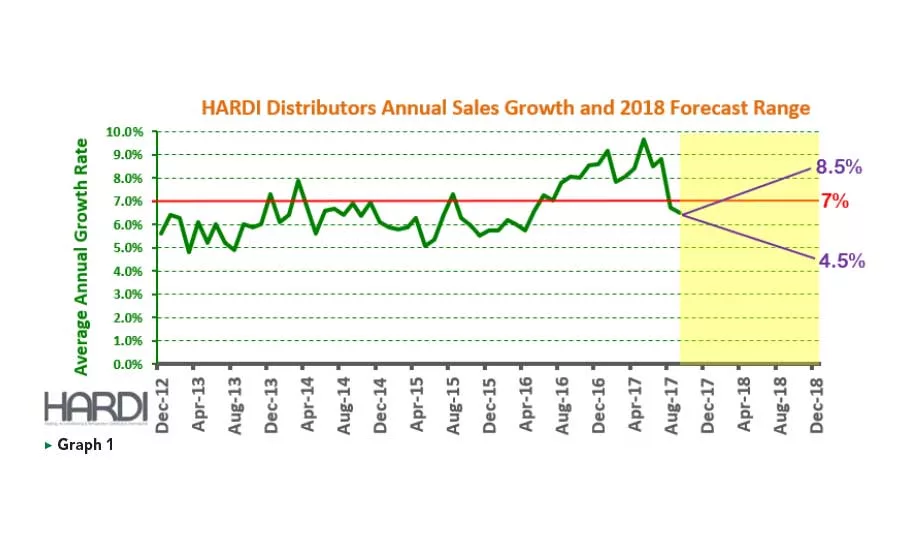
“The net result will be TRENDS sales growth near 6.5 percent in 2017,” was our conclusion last year. That will be very close to the actual result. Let’s see if we can duplicate that performance with our 2018 forecast.
Graph 1 reflects the range of likely average annual distributor sales growth in 2018. The economic pieces of the 2018 puzzle look very similar to this time last year. This range of 4.5-8.5 percent is based on my current view of the key demand variables.
Let’s look at these more closely to see where we should place our stake for 2018.
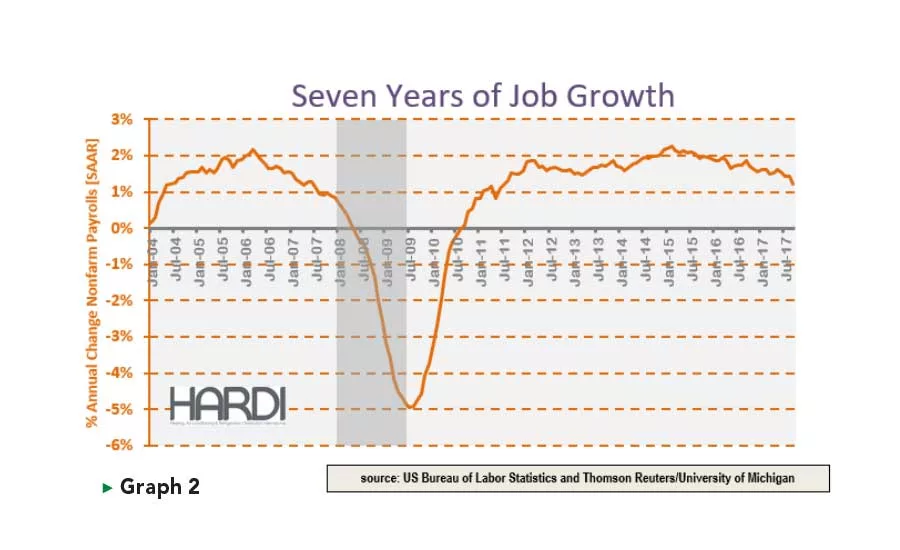
The orange line in Graph 2 tracks the annual growth rate of nonfarm payrolls since before the Great Recession to today. This impressive expansion produced 83 consecutive months of job growth until the hurricane-distorted September 2017 report. That is just a record of data points. The economy is about people, and consumers endured significant distress during and after the bursting of the real estate bubble.
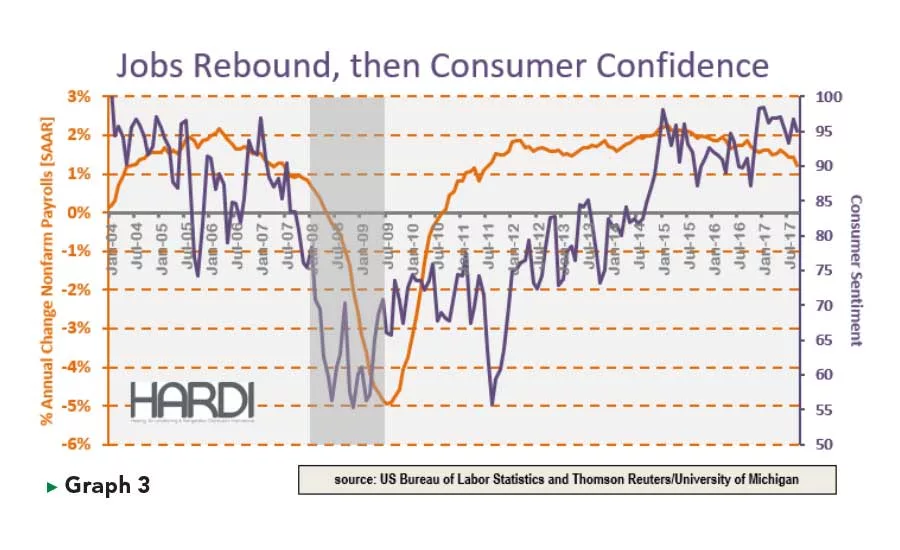
One way of measuring that distress is with consumer confidence as measured by the University of Michigan Consumer Sentiment Survey as shown in Graph 3. This is the index I have always used because it has been around since the 1950s and has consistently provided effective guidance. Technically, the recession ended in 2009, but consumer confidence remained challenged for another four or five years. The distress lasted almost eight years because that is how long it took for consumer confidence to recover to the pre-recession levels of at least 90.
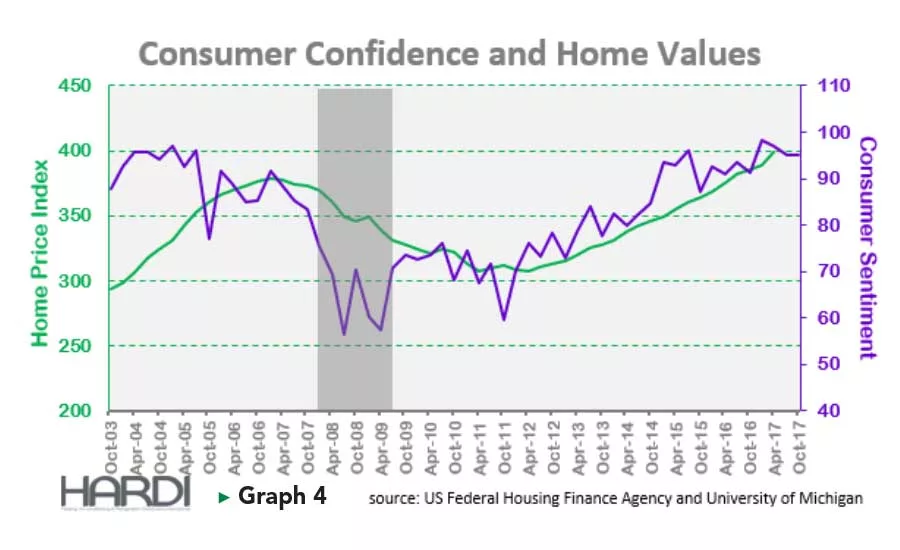
The persistent jobs recovery increased demand for housing. Graph 4 illustrates the virtuous cycle of improving home values supporting improving consumer confidence. This graph, along with the previous one, are the foundation of our forecast because roughly 85 percent of demand is related to the repair/replacement decision, and higher dollar replacement activity correlates well with consumer confidence. This consumer confidence line looks a little different from the one in Graph 3 because it is only the quarterly data point to correspond with the quarterly Home Price Index.
Looking for quick answers on air conditioning, heating and refrigeration topics? Try Ask ACHR NEWS, our new smart AI search tool. Ask ACHR NEWS
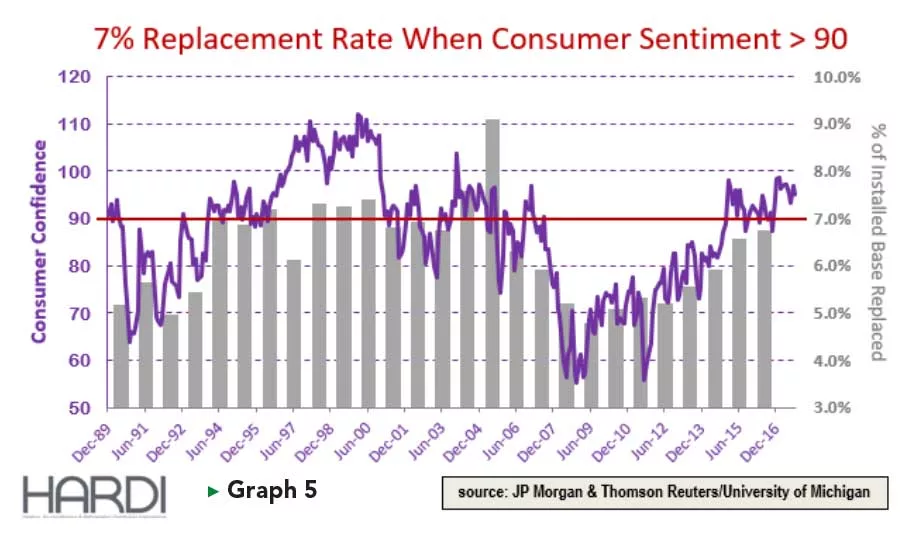
About 7 percent of the installed base was replaced annually from 1994 through 2004, when consumer confidence was 90 and higher, as shown in Graph 5. The gap below 7 percent from 2006 through 2013 is when consumers chose repair over replacement. 2018 will be the fourth consecutive year with consumer confidence over 90, but we are still struggling to achieve 7 percent of installed base replacement activity. We can expect some modest unit growth in 2018 from the post-recession repaired systems and the systems lost to natural disasters.
Existing home sales are a reliable leading indicator of replacement activity, especially in a healthy real estate market like we have today. A new system may accelerate a home sale and homeowners are confident they can recoup the cost of the transaction. At this time last year, the growth rate of existing home sales was slowing to mid-single-digit rates, and that trend continued in 2017. Graph 6 shows the national perspective. Some have attributed the slowdown to a shortage of homes on the market. On top of that, the mature economic recovery is allowing the Federal Reserve to unwind its aggressive actions. This is resulting in rising interest rates, and that trend is expected to continue. It is debatable if higher mortgage rates over the next 12-24 months will discourage buyers or boost demand to beat the next increase. Either way, the higher rates will pinch budgets, pressure values, and aggravate this trend.
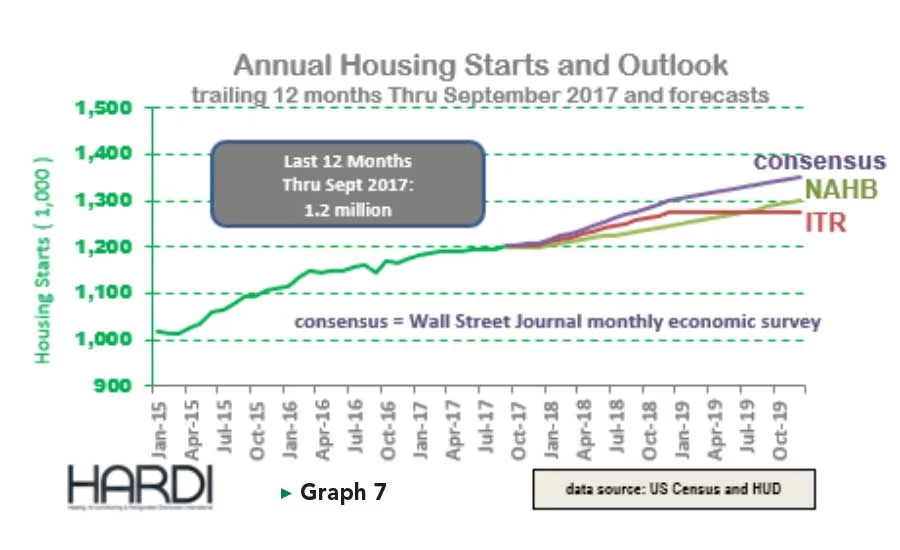
If existing units are responsible for about 85 percent of demand, then new construction would be responsible for the balance (add-on is just a sliver of the market). In recent years, we have learned to expect optimistic forecasts from the National Association of Home Builders (NAHB). They surprised us this summer by trimming their 2018 outlook to be very similar to the expectations of ITR Economics. As of October 2017, ITR forecast 2018 starts to improve by 5.7 percent while NAHB is forecasting a 3.9 percent improvement. This low- to mid-single-digit growth expectation appears to be a bit higher than we could expect from, existing home sales (Graph 7).
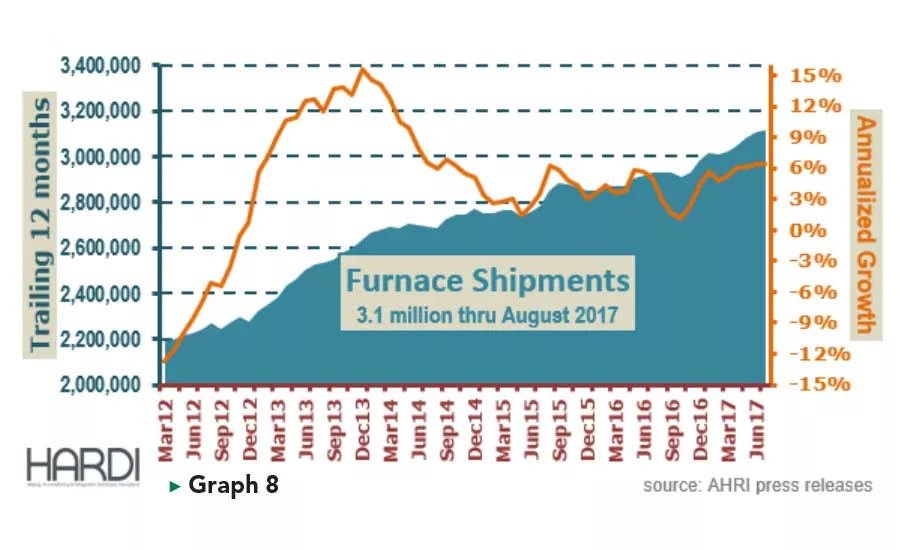
Furnace sales (Graph 8) are a significant portion of the composition of TRENDS activity. These systems last longer, and demand growth has fluctuated between 2-6 percent over the past three years with consumer confidence over 90. With the recent pace at the upper end of the range and existing home sales slowing, a decrease to the lower end of that range is likely.
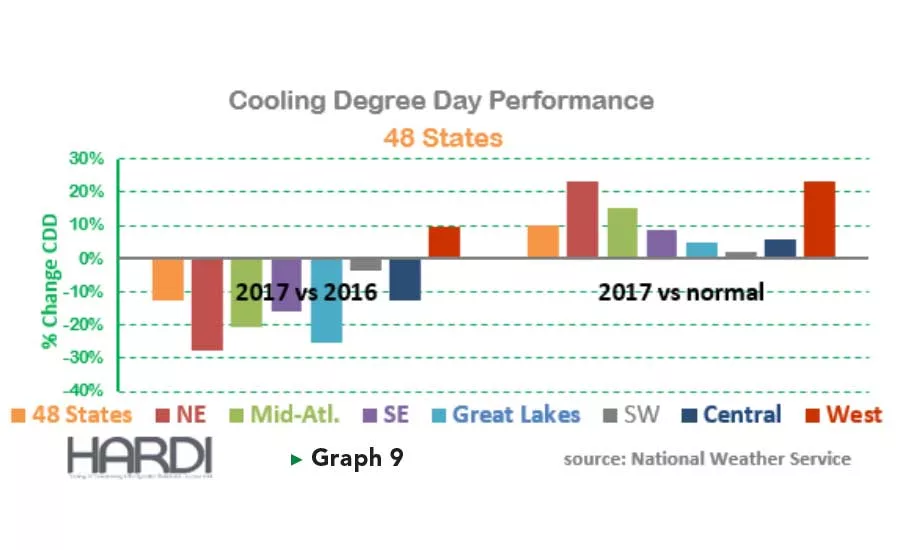
There may be a baseline level of demand derived from all these factors, but every participant in this industry knows the weather will dictate the absolute level of activity in 2018. 2017 was likely to be a year of modest sales growth because 2016 was unusually warm. The result was Cooling Degree Days were down by 12 percent in 2017. The first set of bars in Graph 9 illustrate the declining Cooling Degree Days that six of seven regions experienced in 2017. That does not mean 2018 will have easy comparisons. The second set of bars compares 2017 Cooling Degree Days with the normal levels for our regions. We are not attempting to forecast the weather here, rather we are attempting to see if the comparison in the year ahead will be relatively easy or difficult. With somewhat normal accumulated Cooling Degree Days achieved in the Southwest, Central, and Southeast regions during 2017, we see an environment conducive to higher replacement activity in 2018.
Besides weather, the other key driver of TRENDS activity will be inflation or price increases. Equipment OEMs have a habit of attempting low- to mid-single-digit price increases each year. Raw material prices have increased in 2017, and OEMs are expressing commitment to offset price increases in 2018. This will influence many other products sold by distributors, and participants expect refrigerant prices to continue their drift higher during the year ahead.
Despite a fourth year of consumer confidence of 90 or more, we expect core replacement demand to improve at only a low-single-digit rate in 2018, driven by a nominal change to existing home sales and some pent-up demand. Low- to mid-single-digit new construction growth will add support to unit demand. Weather-related comparison appears to have positive surprise potential for the Southeast, Southwest, and Central regions. And just about everything a distributor sells will be priced higher in 2018 after the raw material cost increases in 2017. Despite modest unit demand growth expected, we forecast 7 percent TRENDS growth in 2018 due to the price increases and the likelihood of a climate more accommodating to equipment demand.
Looking for a reprint of this article?
From high-res PDFs to custom plaques, order your copy today!


