A Peek at the HVACR Industry in 2017

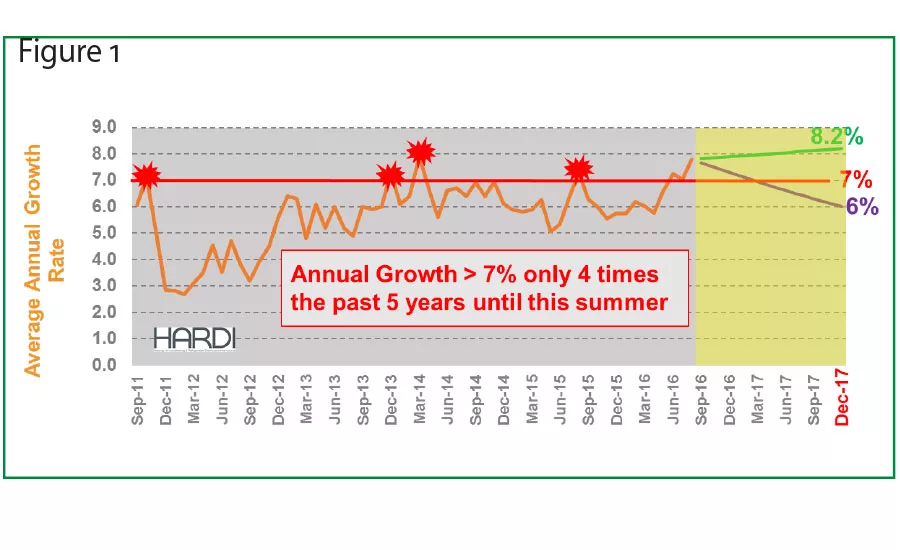
This summer, HARDI distributors reported the strongest consistent growth since the easy comparisons following the Great Recession. The National Bureau of Economic Research tells us that ugly downturn existed from 2008 through the middle of 2009. The beginning and end of recessions are not like turning a lamp on and off. The ability to identify our economic prospects is a gradual process, like when the sun is rising or setting. After the economic sun started to rise in 2009, it was not until the back half of 2010 that a recognizable improvement began to reach HARDI members and turn TRENDS sales growth to positive. Average annual sales growth rates achieved a double-digit pace in 2011 only because the results were being compared with the prior year’s soft recessionary activity levels. A year later, visibility had improved to the point that home values began to recover in 2012. The data in the TRENDS growth rate chart (figure 1) begins after the post-recession distortion.
HARDI TRENDS Annual Growth Rate
Last year, I forecast 2016 TRENDS growth would be 7 percent. One can consider this an optimistic outlook because before this warm summer, annual sales growth during these low inflation years has exceeded 7 percent only four times across the prior five years, or 60 months. Having 7 percent or more was a rare occurrence until this summer, which featured three consecutive months when annualized growth exceeded 7 percent.
Looking backward is boring. It is much more interesting to debate whether the economic sun will keep rising and results will brighten further in 2017. Will this sunny economic environment and sales growth rate persist, or will the normal waning begin, and how quickly could darkness return? I start this discussion by adding an optimistic and pessimistic range of likely results for 2017 to above the TRENDS annual growth rate. I base this range on my familiarity with current data. Now, let’s review the relevant indicators and decide where to place our 2017 forecast stake within this range. The result will be a function of the overall economic performance, the influence on housing activity, and the impact on equipment demand.
HVAC Demand Indicators
Gross domestic product (GDP)may be a popular scale for economic activity, but industrial production is ITR Economics’ preferred barometer of economic health. After a slight contraction in 2016 (a declining energy sector was the culprit), ITR Economics expects industrial production to recover during the back of 2016 and throughout the new year, culminating in a healthy 2.7 percent gain in 2017. Strong consumer demand will drive this thanks to the extended period of employment growth, low unemployment and wages increasing at the fastest pace since before the recession.
The gradual recovery may have been a topic of derision during the political season, but the gentle pace has helped avoid overheating and dislocations that interrupt expansions. ITR is forecasting housing starts to improve by 5.5 percent in this seventh year of expansion and then surge to almost double that pace or 10.9 percent growth in 2017.
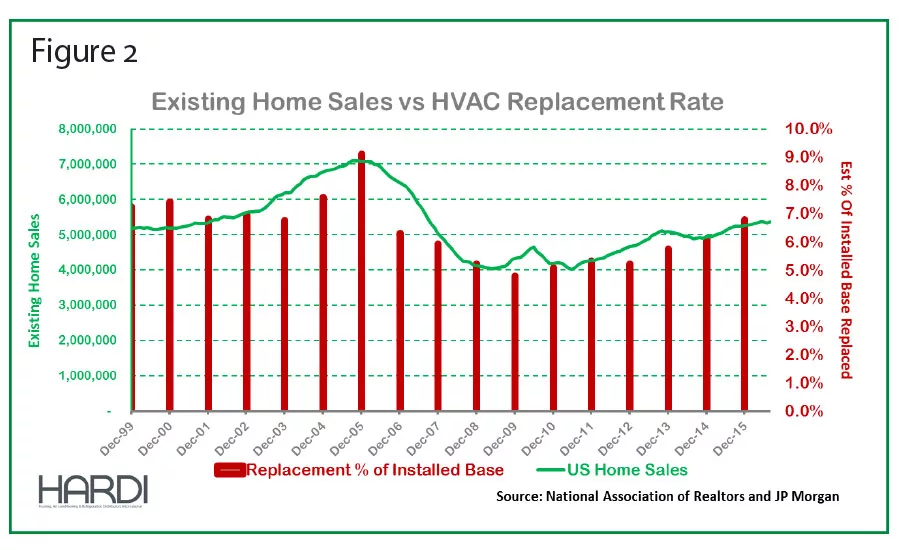
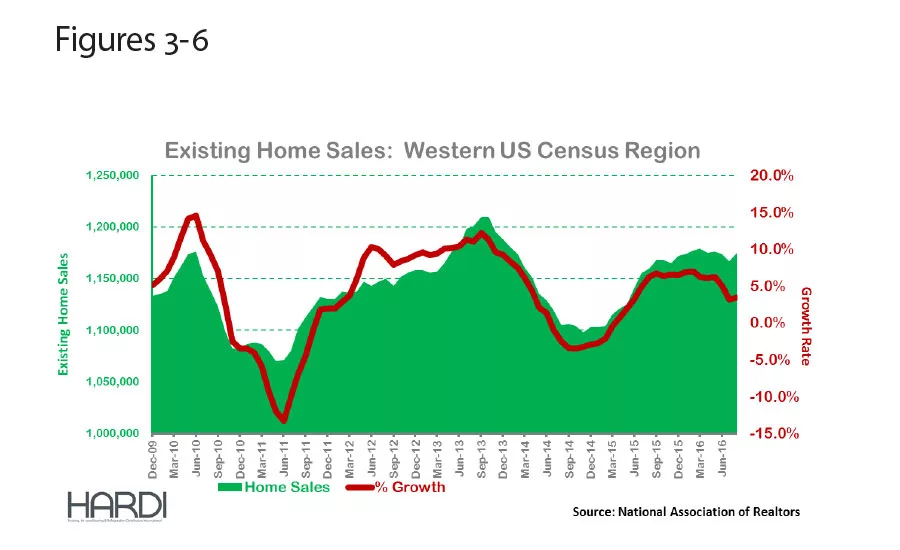
HARDI members who support the new construction market will certainly benefit in 2017, but the vast majority of HARDI member sales are to existing properties. One of the best indicators of equipment demand, and therefore TRENDS performance, is existing home sales. Figures 3-6 on page 20 illustrate the tight relationship between JP Morgan’s estimated percentage of the installed base that has been replaced each year versus existing home sales.
Equipment shipments for new construction vary from 10 percent to 15 percent of the annual total. That implies we can attribute 75 percent to 85 percent of HARDI distributor sales to activities associated with equipment repair or replacement. The rate of existing home sales is leveling and that could have a similar impact on HARDI distributor sales in 2017.
Looking for quick answers on air conditioning, heating and refrigeration topics? Try Ask ACHR NEWS, our new smart AI search tool. Ask ACHR NEWS
HARDI distributors in the West have experienced double-digit sales growth since December 2015. The low teens achieved through this summer is unsustainable. The chart on page 20 of Existing Home Sales in the U.S. Census Western region indicates growth has been cut in half from nearly 7 percent at the beginning of the year to the 3.5 percent area this summer. The TRENDS Western region will not be reporting double-digit sales growth in 2017.
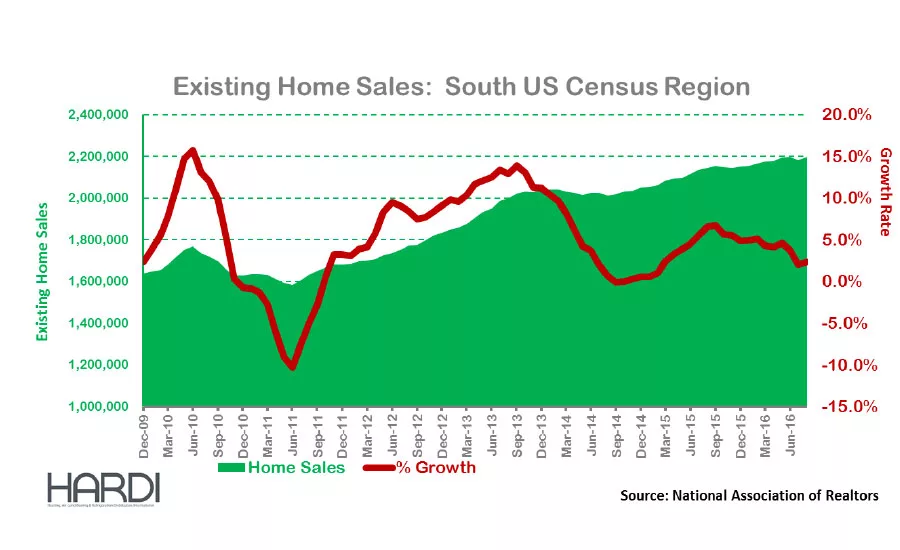
The Southeast is an important region for HVACR sales and has been a TRENDS laggard in 2016. The Southwest has been reporting improving sales growth in 2016 and ITR is forecasting a healthier economic environment for the Southwest in 2017. Together, they comprise the U.S. Census Southern region, where the growth rate of existing home sales has been cut in half from the 5 percent area at the beginning of 2015 to 2.5 percent by the end of the summer. This does not bode well for sales in 2017 by HARDI distributors in the South or Southwest.
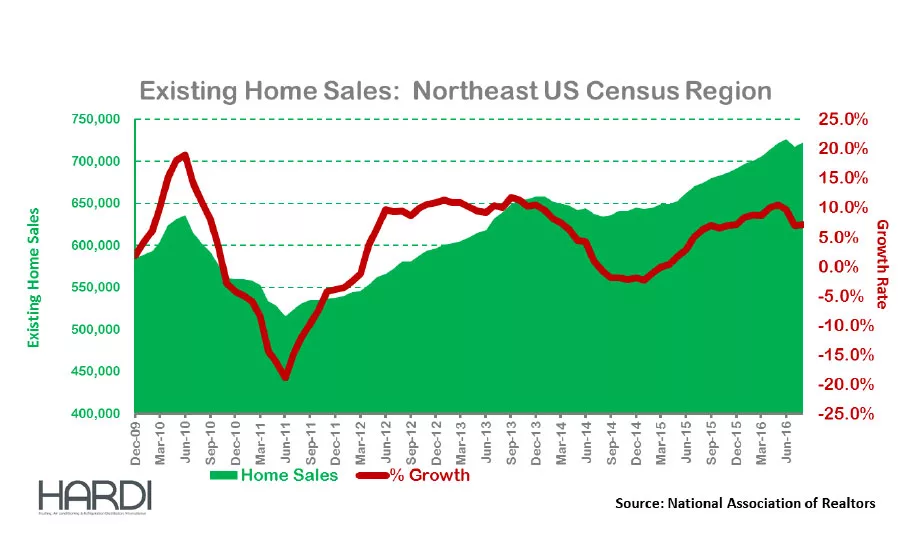
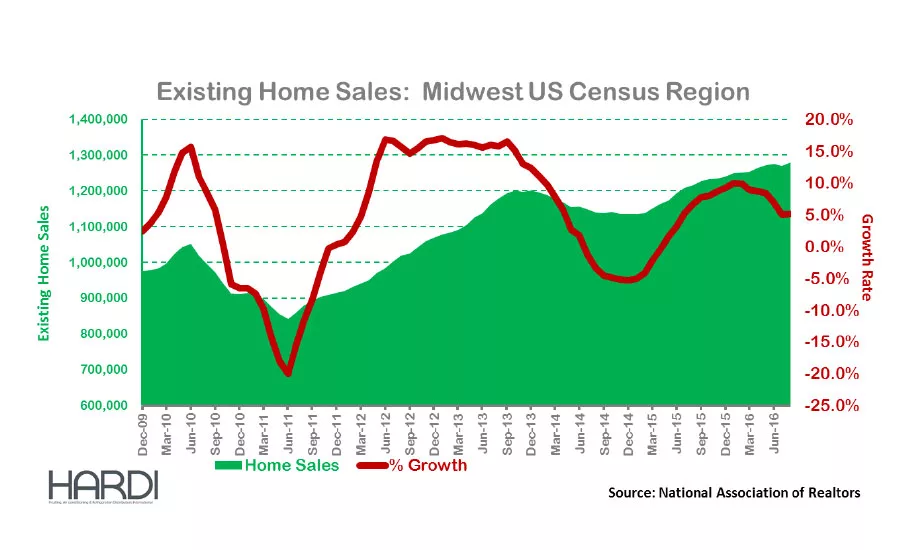
The Midwest has a similar story of existing home sales growth being cut in half this year, but the current pace is a respectable 5 percent. The Northeast is coasting versus having the brakes applied in the South and West. According to this indicator, the Northeast will be the sole proponent for the 2017 TRENDS growth rate at the higher end of our forecast range.
Even if new housing starts surge by 11 percent or more in 2017, as ITR Economics and others suggest, the net increase in unit demand is only about 150,000. That would have little impact on 2017 annual TRENDS growth beyond the market of nearly 7 million units in 2016, especially with existing home sales growth waning. That leads us to consumer confidence, my favorite indicator of TRENDS prospects because it illuminates activity for new and existing properties.
The Great Recession is a fading memory for many Americans after more than 70 consecutive months of nonfarm payroll growth. The orange line in Figure 4 on page 22 reminds us of the depth and duration of the contraction. The purple line tells us how long it has taken for consumer confidence to recover. The indicator has been in the 90s territory and signaling receptive consumers throughout 2015 and 2016. We expect consumer confidence to remain over 90 in 2017 as the gradual recovery finally begins to engender recognizable wage growth.
In Figure 5 on page 22, once again, consumer confidence is the purple line, and we compare it with the green line representing the annual percent of installed base replacement. If the “normal replacement rate” is between those red lines of 6 percent to 7 percent, then 2008 through 2013 is when replacement was postponed. There was an unusual number of systems repaired during that period. This indicates the installed base is older than normal. These older systems that have experienced repairs are one of the most visible remnants of the bursting of the real estate bubble that inspired the Great Recession. An installed base that is older than normal combined with improving home values and rising wages describes a healthy environment for replacement in 2017.
2017 Forecast
The catalyst of existing home sales may not be packing the same level of octane in 2017, but existing homeowners will still need to replace their aging systems. With the phase-out of R-22 by 2020, many of those replacements will require additional parts for the indoor equipment. The absolute impact of the higher cost of a replacement is difficult to quantify, but it will have a positive impact on distributor’s sales. Sales growth will need that extra spice because there is little reason to believe the absolute number of units shipped will change dramatically in 2017. It appears unit demand will remain near this pace. I do not see a reason for a noticeable increase in the pace.
If industrial production improves in 2017, as forecasted by ITR, higher commodity prices are likely to follow. Those costs will be passed through to customers and boost distributors’ top lines. Wages are increasing at the fastest pace since before the recession. This will inspire price increases, or at least discourage discounting, resulting in another factor supporting distributor’s top line next year.
The hot summer this year will inspire more planned replacement activity early in the season, offsetting the risk of a cool summer season next year. Higher commodity prices and product prices will have a positive impact on distributors’ 2017 top lines, and healthy unit demand will persist due to the aging installed base. System replacements will include additional parts with the phaseout of R-22. All those factors help the top line that probably comprises a similar number of units being sold. The net result will be TRENDS sales growth near 6.5 percent in 2017.
Looking for a reprint of this article?
From high-res PDFs to custom plaques, order your copy today!


