Looking Through a Glass HARDI

The leaves have stopped changing color, and football is still on TV, so that means it is time for members to call for assistance with their market analysis for the year ahead. At HARDI, we continually monitor a variety of national and regional economic data points to help our members understand the health of the markets where they operate. We also have proprietary data from our TRENDS monthly distributor sales analysis report and a quarterly unitary market share report. We are ready to support members with insight into the direction and pace of their markets, any time of the year. Most members have calendar fiscal years, so discussing the story being told by the HVAC indicators is frequently done while discussing the relative merits of players for our fantasy football teams. Many HARDI members are informed, entertaining and passionate about both topics.
According to our TRENDS report, HARDI distributors’ average annual sales growth remained rather steady in the 6.5 percent area for most of 2014. This national average is comprised of regions experiencing growth on both sides of that level. We support our members with insight into the relative strength of their specific regions. We do not possess magical equations to predict what the average national growth rate will be in six or 12 months, or what date a specific forecast growth rate will be achieved. We do expect the overall average growth rate to be improving during 2015 and will probably exceed 8 percent during the back half of 2015. That is not a bold prediction, and here is why.
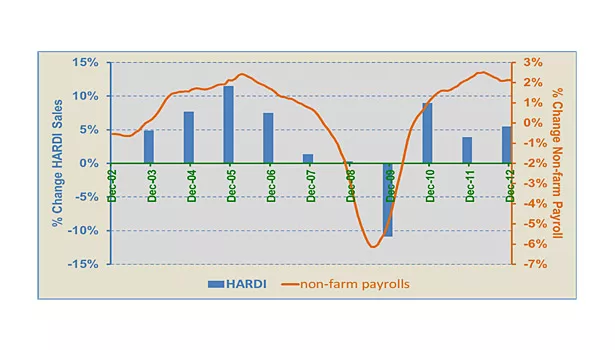
The graph below compares the orange line of nonfarm payroll growth with blue bars for average annual distributor sales growth. The two series appear to move together until the recent Great Recession. There was a snap-back of demand in 2010, presumably after postponement of purchases in 2008 and 2009, but demand did not persist into 2011 and 2012. We believe that reflects the lingering effects of the economic crisis and consumers’ reluctance or inability to reinvest in their homes. Another way of describing the gap is “pent-up demand.” However, that phrase has connotations that detract from the credibility of any outlook discussion with some industry participants.
A phrase that industry participants do agree with is that HVAC is primarily a replacement driven business. New Housing Starts data get lots of attention each month, but new construction is generally responsible for only 15 percent of HVAC demand. What we discovered was that consumer confidence, which had shattered, was healing; yet they still postponed replacement decisions.
The systems do not last forever, and the installed base has been getting older through the years as residential markets have been recovering. Eventually, the installed base of more than 80 million systems will be too expensive to repair or operate and will need replacement. During 2014, we heard many stories from members indicating replacement activity was improving in their region. There is enough anecdotal evidence for us to believe the pace of replacement activity will continue to improve.
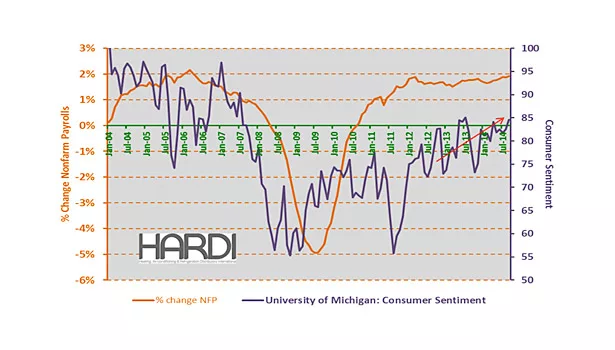
Our favorite barometer of consumer confidence comes from the University of Michigan. They have measured sentiment for more than 30 years. The purple line in the chart indicates confidence was generally in the 90s before The Great Recession of 2008. As nonfarm payrolls contracted, so did Consumer Confidence to the 60s. Consistent payroll increases have contributed to an improving outlook by consumers. During the back half of 2014, this index has demonstrated its best performance since before the financial market and real estate implosion.
Consumer confidence is now in the low 80s and headed higher. This level of confidence is consistent with consumers being more comfortable choosing to replace their aging HVAC systems.
Looking for quick answers on air conditioning, heating and refrigeration topics? Try Ask ACHR NEWS, our new smart AI search tool. Ask ACHR NEWS
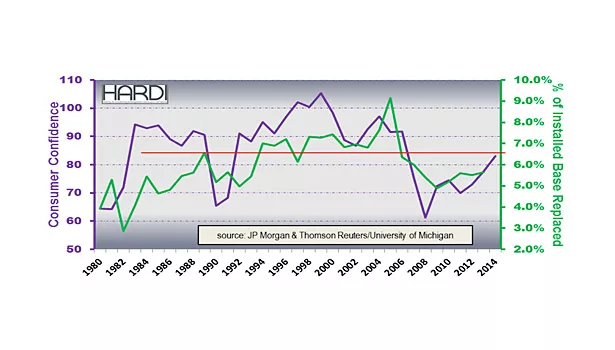
Stephen Tusa of J.P. Morgan has done a remarkable historical analysis of residential replacement market activity. From his work, we calculated the green line in the chart (next page) representing the percent of the installed base replaced and compared that with the purple line of consumer confidence. During the 10 years before the Great Recession, there was 7 percent replacement of the installed base annually. Average replacement activity dipped to the 5 percent area during the five years since the economic slowdown. If the historic relationship persists as we expect, then replacement activity will improve to at least 6.5 percent of the installed base as consumer confidence approaches the mid-80s.
The gradual economic recovery has produced employment growth every month since late 2010. This consistency has supported the recovery of confidence by consumers and business owners. That should lead to increased commercial construction activity. The Architecture Billings Index [ABI] is a leading indicator of construction activity that The American Institute of Architects produces monthly. The ABI is indicating increased activity in 2015. In September, their Chief Economist Kermit Baker said that “long-stalled construction projects are starting to come back to life in many areas across the country.”
Until this year, commercial HVAC companies were consistently telling stories about construction project delays. Now we are hearing encouraging comments about the commercial HVAC market from leading participants like Johnson Controls, AAON and Comfort Systems USA. The tone of improving momentum is similar to what we have seen on the residential side. Baker attributed some of the fuel for this activity to a renewed appetite by lending institutions to support commercial market activity.
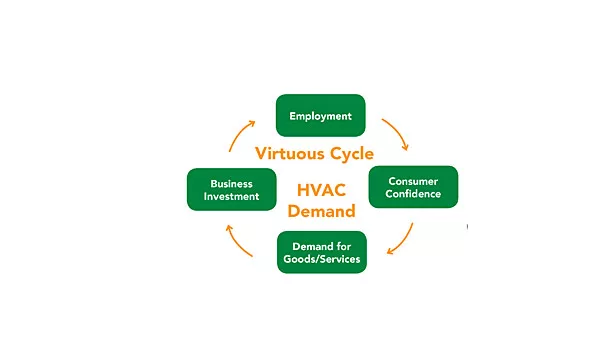
The HVAC demand story sounds like a classic Virtuous Cycle driven by recovering confidence unleashing demand. We see this cycle rolling in the key markets of the U.S.
We have defined seven regional groups of states for our market monitoring efforts. We can confirm the top down perspective with a bottom up view of the seven regions to see if this Virtuous Cycle has any momentum. The greatest influence on the national outlook will come from the West, Southwest and Southeast regions that together comprise roughly half the population and two thirds of new housing permits.
The Southeast is more than 20 percent of the population and one fourth of the new housing permits. Our TRENDS monthly sales analysis report indicates annual sales growth in the Southeast has been consistently improving since late 2013 to near double-digit rates. This sales growth in the Southeast should be supported by healthy nonfarm payroll growth that has been near 2 percent during the past year. New housing permit growth in the South has slowed to midsingle digit territory, but their commercial outlook is more encouraging after two years of consistently positive ABI reports for the region.
The impressive ABI for the South would include the Southwest region, which Texas dominates. The Southwest is less than 15 percent of the population but is 20 percent of the housing permits. Eighty percent of the Southwest housing permits are in Texas, where nonfarm payroll growth crossed into the 3 percent territory during the spring. This has inspired housing permit growth to accelerate from 10 percent in the spring to mid-teens territory this fall. TRENDS sales growth is down to the low-single-digit territory. With the solid growth prospects in the Southwest, this region will be a potent engine driving improved TRENDS performance next year.
The Western region is 20 percent of the national permits and home to 20 percent of the population. Sales in the West have been in the low single-digit growth range recently. There is wide disparity of growth across the 10 states in the region, but the combined nonfarm payroll growth rate is also more than 2 percent, like in the Southeast. Housing permit growth is in the mid-to-upper single digits, but the major markets of California, Arizona and Washington are near double-digit. The ABI for the Western region has generally been positive, but nothing to get too excited about. The combined benefits of the other factors should be enough to lift the TRENDS growth rate for the Western region. The rolling three month average sales growth already exceeds the annual rate and thus will be pulling the annual rate higher.
The Consumer Confidence Index is approaching the mid-80s. That level is consistent with 6.5 percent of the installed base of 80 million residential systems or 5.2 million being replaced during the year ahead. When we add to that at least 1 million for new construction and 0.5 million for add-ons, the result is 6.7 million systems. 6.7 would be an 8 percent improvement from the sell-in shipment rate before pre-buy distortions. We see healthy or improving economic data in the major regional markets that will drive that demand. The net effect paints a picture of 8 percent-plus HVAC distributor sales growth in 2015.
Looking for a reprint of this article?
From high-res PDFs to custom plaques, order your copy today!


