Making Better Decisions with Business Forecasting

Once, a colleague of mine became enamored with a new forecasting technology whose “targets” he consistently beat. In time, however, his performance became markedly closer to the forecast “targets,” often missing them by only a small amount. He wondered if his business forecasting tool was still effective. Indeed it was since, over time, the forecast was accurately predicting his overall performance.
But he didn’t see it that way. He was treating the predictions as goals to beat rather than as insight into the general direction of his sales. As we’ll see, human biases plays a significant role in how we build and interpret models—more than we’d like to admit. Many would prefer only forecasts they can beat, but this is problematic.
The failure to predict the housing market collapse is a sobering reminder of too much emphasis on business forecasts. The brightest minds in this country and considerable investment built many of these housing market models. But great complexity and cost don’t guarantee accurate predictions.
In the context of these narratives, the reason many small and medium-size businesses don’t want to perform detailed business forecasts becomes clear. CEOs, CFOs and business owners are afraid the complex nature of their business will require a complex forecast model they can’t understand and significant investment they can’t recoup.
I’m here to challenge these assumptions. Simple techniques exist that can be implemented in a spreadsheet program like Microsoft Excel. These techniques are easily understood, easily created and inexpensive to use and maintain (I’m willing to guess you’re already using Excel or a similar spreadsheet tool). As the opening narratives demonstrate, neither new technology nor complexity nor cost will guard you against bias and model misuse. But with critical thinking to evaluate a given model, and a healthy dose of skepticism in which to contextualize its results, your business forecasts will provide you with immense insight upon which to make decisions.
A Brief Introduction to Business Forecasting
Business forecasts are the application of qualitative and quantitative models to make educated guesses about the future. For this article, we’ll focus on quantitative models.
A quantitative model is a simplified version of reality derived from historical data and some mathematics. However, models are not reality. The famous statistician George E.P. Box once observed, “essentially, all models are wrong, but some are useful.” We often forget this.
Looking for quick answers on air conditioning, heating and refrigeration topics? Try Ask ACHR NEWS, our new smart AI search tool. Ask ACHR NEWS
Because reality is complex, it’s easy to believe more complexity equals better predictive results. However, if the underlying data and assumptions are wrong or baseless, the model is baseless. Such models are commonly referred to as GIGO: Garbage In, Garbage Out. GIGO models often hide their ineffectiveness behind complexity.1
Any good quantitative model must account for the following effects found in time series data:
• Seasonality and Cyclicality
• Trend
• Randomness
Let’s go through each effect.
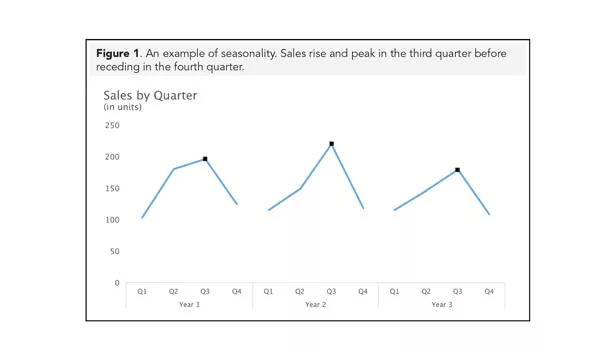
Seasonality and Cyclicality
Seasonality is a data pattern arising from seasonal factors. Figure 1 shows an example of a seasonal sales pattern that peaks in the third quarter. Cyclicality is similar to seasonality, but its pattern is less tied to seasonal factors. For example, cyclicality is found in the boom and bust business cycles of stock market data.
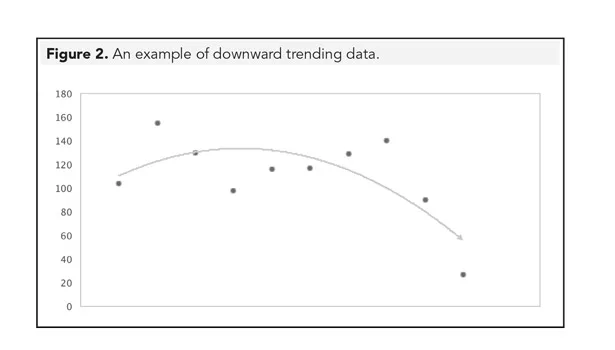
Trend
Trend is the overall direction of the data. Figure 2 shows data trending downward near the end of the series.
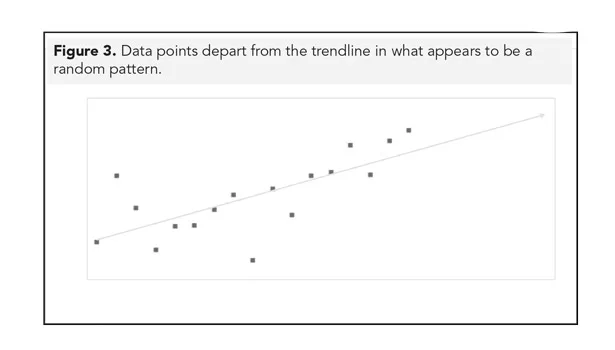
Randomness
Randomness is the variation left over once we’ve accounted for seasonality and trend. Figure 3 shows data points that appear to dance around the trendline without any discernible pattern. This effect is called randomness.
Now compare Figure 3 to Figure 4. Notice that while a trendline exists, a discernible pattern of movement still appears among the data points. Some underlying effect—in this case, seasonality—has not been captured well by the trendline. What’s leftover is not random but unexplained.
Forecasting Techniques
In this section, we’ll discuss forecasting techniques you can implement in your own business with Microsoft Excel. I’ve kept the math light for two reasons. First, Excel can do complicated forecasting techniques, often with little to no math. Second, it’s more important that you understand what the model is doing.
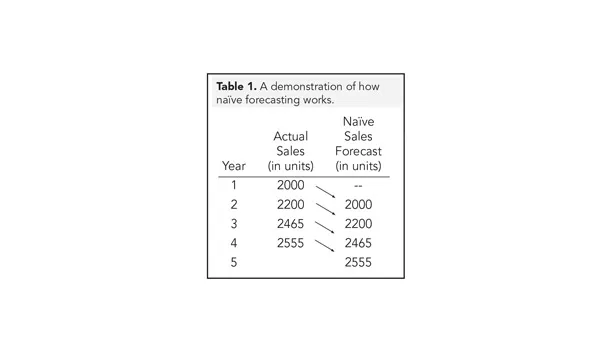
Naïve Forecasting
Naïve forecasts are by far the easiest and least expensive business forecast techniques to implement. Actual historical data from the previous fiscal period is used for the current period.
Table 1 shows an example of naïve forecasting.
Naïve forecasts set the baseline against which to compare more complicated models. In other words: A more complicated model needs to be at least as accurate as a naïve forecast. You’ll see what I mean by this in the discussion on Causal Techniques.
Simple and Weighted Moving Averages
Another type of business forecasting involves the use of averages. They’re great for capturing the general trend and seasonality in your data. We’ll discuss two averaging methods: (1) simple moving averages, and (2) weighted moving averages.
Calculating a Simple Moving Average
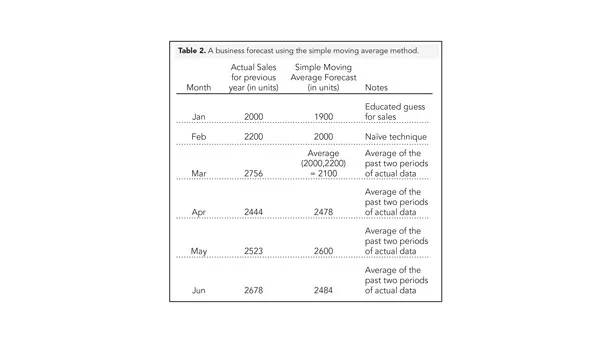
Table 2 shows an example of a simple moving average business forecast. Moving averages predict the next data point by taking an average of two or more previous periods of actual data.
In this example in Table 2, we don’t have data for January so we make an educated guess. For February, we use the naïve method. We do this because there are not two prior periods to average until March. After March, we employ the simple moving average.
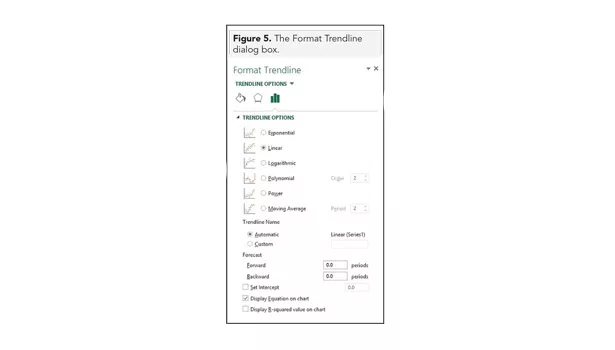
I only average two periods for simplicity sake, but your model might require more periods for better prediction. Simple moving averages are easily implemented in Excel. Figure 5 shows the Format Trendline dialog box in which you can insert a moving average forecast and include more periods if necessary.
Averaging too many periods can improperly peanut-butter spread the past into one data-point.
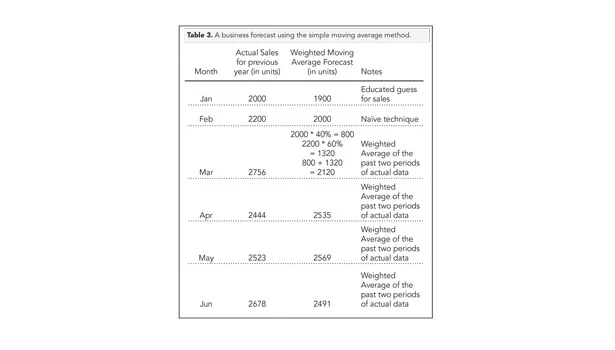
Calculating a Weighted Moving Average
One way around peanut-butter spreading the past is with a weighted moving average. The simple moving average treats all past periods with equal consideration. The weighted moving average gives more importance to the most recent period and less importance to periods prior. Table 3 shows an example where the most recent period is given a weight of 60 percent and the period prior is given a weight of 40 percent. Weights should always add up to 100 percent as a standard practice.
Moving averages are not a native Excel feature but are easily constructed with formulas.
Causal Techniques
Causal techniques assume an underlying relationship between independent variables and business outcomes. For example, independent variables like income, gender and time might have a predictive relationship with buying habits. We call the most common causal time series technique regression.
Regression works by fitting a curve to a set of time series data. The curve can be any shape, but often a simple trendline (commonly called “the line of best fit”) will do. We assume (hope) the fitted curve gets us close to capturing the true underlying relationship.
Figure 6 shows an upward trending line fit to monthly revenue using regression (Excel does the regression calculation behind the scenes). Regression can be very good at summarizing the trend of the underlying data into an easily interpretable line. For instance, the trendline in Figure 6 shows an increase of $420,000 in sales each month, on average, assuming no significant changes to operations.
There are many types of trendlines to choose from within Excel. You can add them to your plot through the Format Trendline dialog box (see Figure 5). You should pick a curve that both reduces distance between the data points and the curve and that best accurately reflects the underlying relationship.
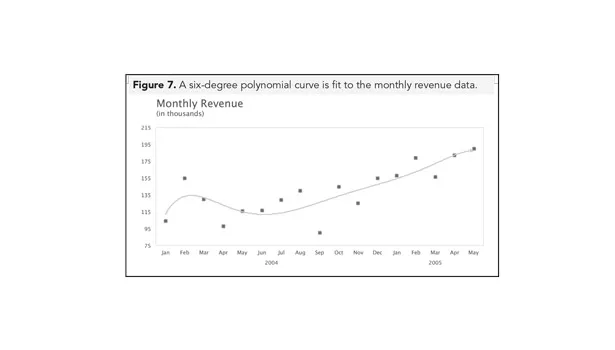
Simply picking a curve only because it appears to be a great fit is a common (and costly) mistake. For example, Excel will let you apply a six-degree polynomial to fit the data. Figure 7 shows monthly revenue using a six-degree polynomial curve.
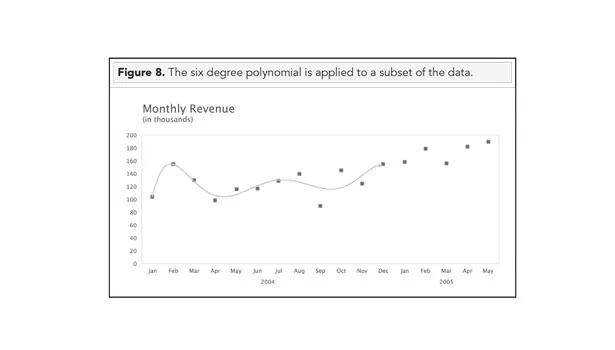
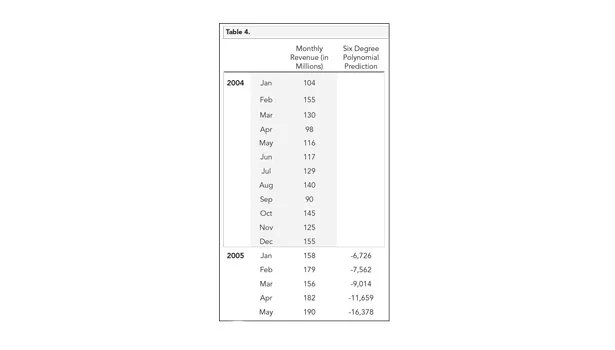
Now let’s test its predictive ability. We can do this by fitting the six-degree polynomial to just a subset of data. In Figure 8, we fit the curve only to data in 2004. We can then use the equation of the polynomial2 to predict the next five points whose values we already know. Figure 8 sets up the experiment.
Table 4 shows the actual monthly revenue vs. the predictions of the six-degree polynomial.3 The predicted values are way off. If we were to simply use a naïve forecast instead—the benchmark against which to compare complicated models—it would do a better job.
Choosing the six-degree polynomial is an example of over-fitting the data. The predicted results reflect more of the polynomial equation than reality.
Final Thoughts
Business forecasting is as much an art as it is a science. The quantitative model you choose is actually less important than your continuous evaluation of its efficacy. You must use personal experience and intuition to understand, evaluate and contextualize results.
It’s easy (and wrong) to believe the “subjective” opinion of an expert is less “true” than hard, “objective” data. Both data, and our interpretation of it, are open to bias. When we’ve invested a lot of time and money into building or acquiring a business forecast enterprise system, it can be hard to question its results. Many vendors have convinced us predictions are for naught without some new, flashy big data technology.
But, by at least beginning our forecasts in Excel, we can develop a model with little to no expense, mitigating any cognitive pressure that might encourage us to overlook underlying problems. GIGO models are much easier to spot and fix with Excel.
We should remember there is nothing privileged about data or technology. As with any business case, we need strong critical thinking skills, comfort with uncertainty and a healthy dose of self-awareness to make good decisions. Business forecasts are no different.
1Another mantra to consider is Albert Einstein’s version of Occam’s Razor: “Everything should be kept as simple as possible, but no simpler.”
2 1y=-0.0136x6+0.5706x5-9.3068x4+74.413x3-299.5x2+550.48x-212.3.
3 I use a table here instead of a chart because the differences are too significant to represent visually.
Looking for a reprint of this article?
From high-res PDFs to custom plaques, order your copy today!


