Performance Benchmarks Can Help Your Company Reach its Goals

What does it take to be a successful entrepreneur? Hard work. Instinct. Confidence. Leadership. Vision. Gut. What about data?
Now more than ever, entrepreneurs are turning to data to validate their gut feelings and complement what’s made them successful. That’s what it takes to win in today’s marketplace. Successful companies can no longer rely solely on customer service and hard work to sustain a competitive advantage.
However, high-quality performance metrics simply don’t exist for independent businesses in the same way they do for large corporations, until now. Introducing the new Distributor Performance Dashboards (DPD) powered by CoMetrics.
At CoMetrics, we’re committed to using technology to tip the scale in favor of independent businesses. That’s why we’ve partnered with Heating, Air-conditioning & Refrigeration Distributors International (HARDI) to share what we’ve built with HVAC distributors. Our goal is to provide metrics that inform better decisions and leave HARDI members stronger and more profitable. That’s what we do. We provide strength in numbers.
So what? As a leader in HVACR distribution, why is data important, and how would I use the metrics presented on the CoMetrics platform? While benchmarks may be utilized in multiple ways, when employed effectively, the following five steps have produced a significant impact.
1. Relative Position
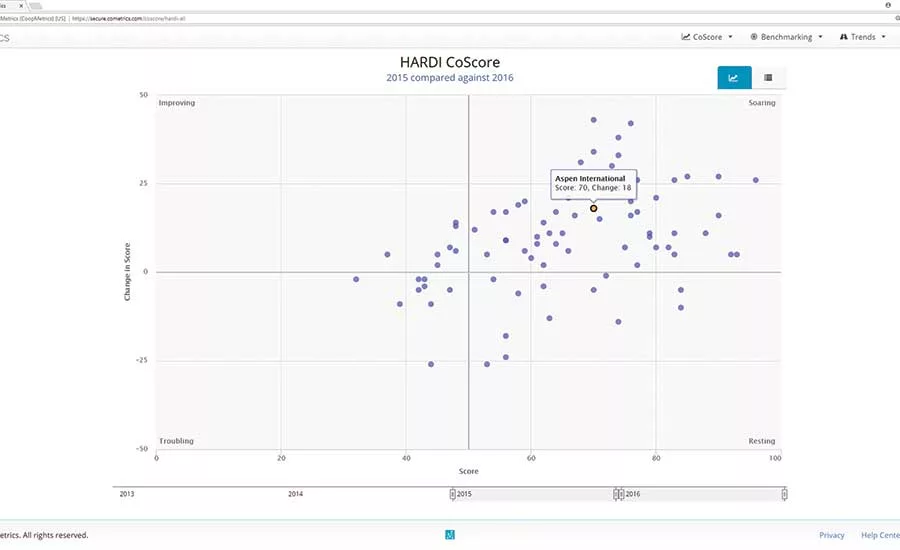
How is the industry doing? How do I stack up? To answer these questions, we turn to the CoScore available on DPD powered by CoMetrics.
In 2016, three out of four HARDI members improved their performance as noted by the majority of dots (companies) appearing on the top half of the CoScore display. This scatter diagram assigns a performance score for each participating member and the change in score is plotted on the y-axis.
Looking for quick answers on air conditioning, heating and refrigeration topics? Try Ask ACHR NEWS, our new smart AI search tool. Ask ACHR NEWS
A company we’ll call Aspen Intl. — a HARDI member with real data that I’ve masked to protect confidentiality — is doing well and getting better as indicated by a score of 70 and improvement of 18 points.
This context is critical in realizing value from benchmarks. It allows leaders to know and react to a growing or shrinking industry while providing a clear barometer of performance that is relative to the group.
2. Identify Opportunities
How did Aspen get there? What can the company do to continue to improve? Turning to the benchmarking data, we can clearly see several potential performance opportunities.
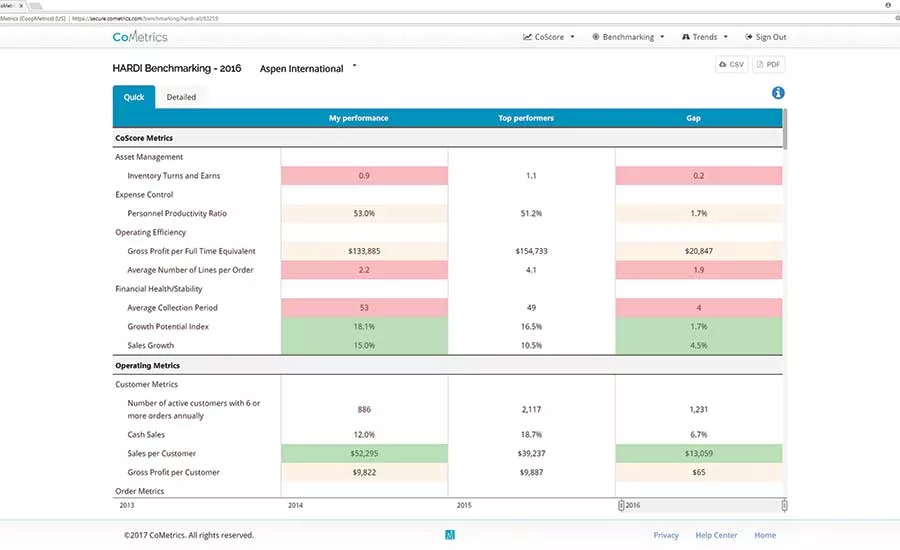
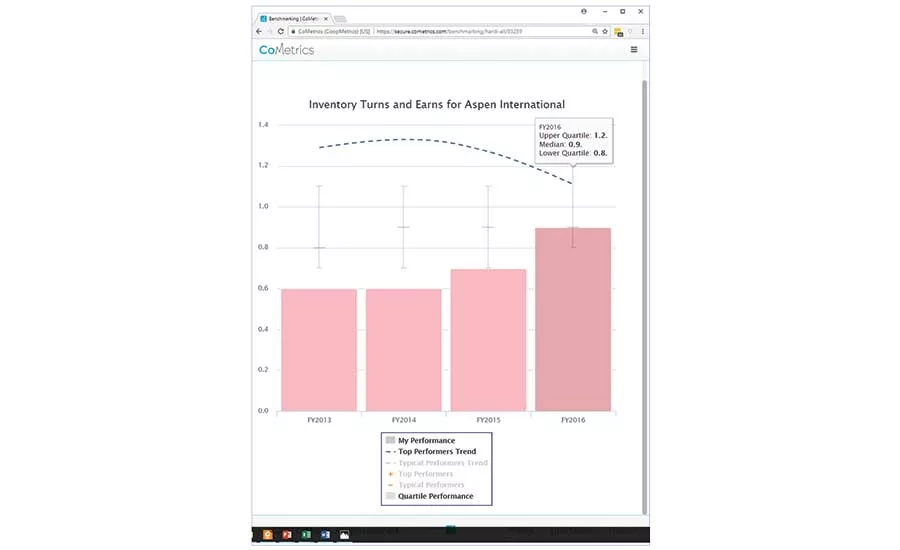
In particular, “inventory turns and earns,” or gross margin times inventory turns, is lower than the average of the top-performing HARDI members: 0.9 vs. 1.1. An opportunity may exist to close that gap. Based on the historical performance of both Aspen and the top-performer averages, they are making solid progress.
3. Unpack Drivers, Seek Best Practices
It’s important to understand what’s driving a change in performance. For example, turns and earns considers everything from product mix, pricing, and cost of goods to velocity. Distributors with strong turns and earns sometimes have very high margins and low velocity but produce the same amount of gross profit dollars as distributors turning out high volumes of lower-margin products.
Aspen’s performance improvement was driven by velocity and not gross margin.
The company’s gross margin has been consistently flat and in fact dipped in 2016 from 19.8 to 18.8 percent, while inventory turns jumped from 3.7 to 4.7.
To continue this trend and close the turns and earns gap, we turn our focus to inventory turns.
For Aspen, now is the time to consult with peers and understand what they are doing to drive increased velocity.
Is it a certain mix of products, positioning, or pricing? Perhaps continuing to shrink gross margin with lower pricing could increase volume and result in closing the turns and earns gap.
4. Set Goals and Implement Changes
Benchmarks help define what is achievable and highlight a range of what’s possible. Goals can be set with confidence knowing that peers have achieved these results.
Half of HARDI members are achieving turns and earns between 0.8 and 1.2. A quarter are below 0.8, and the balance is above 1.2.
In setting a target for Aspen, we know that the top performers average 1.1, and 25 percent of HARDI members do better than 1.2. Therefore, a goal of 1.1 is not only reasonable based on peer performance but shows there is plenty of room to outperform.
5. Monitor and Reward
Setting aside time on a regular basis to review performance metrics provides needed space to reflect on actuals versus goals.
One CoMetrics user gave his entire team a $20 bill every time it was in the top quartile of a specific metric. While no one was ready to retire that year, this helped create a culture of using relative metrics to define performance and set incentive targets. Further, it helped boost morale during years of decline as incentives were still paid based on relative performance so long as they beat their peers and declined less rapidly.
Using data to strengthen independent businesses and help build a sustainable competitive advantage is exactly why CoMetrics has partnered with HARDI and other forward-looking associations. My goal is that this data can now be used to inform decisions and improve performance, which leads to more profitable and stronger independent distributors.
Looking for a reprint of this article?
From high-res PDFs to custom plaques, order your copy today!


