Streamlining Distribution Center and Warehouse Operations with Predictive Analysis
Warehouse execution systems improve workflow, inventory tracking, and more

The more accurately warehouse and distribution center managers can predict labor requirements, space availability, workflow and other variables, the more effectively they can operate their facilities. This is becoming easier every day thanks to advancing warehouse execution systems (WES) that can combine information from disparate solutions to provide automated tracking of key operating variables, which can help identify anomalies and trends. The result allows a forward-looking view of workflow, adjustments to labor and inventory before issues arise. Trending analysis supports refining future operations for long-term savings, as labor costs, space allocations and workflow are the most critical variables that WES software helps control.
Optimizing Labor Requirements
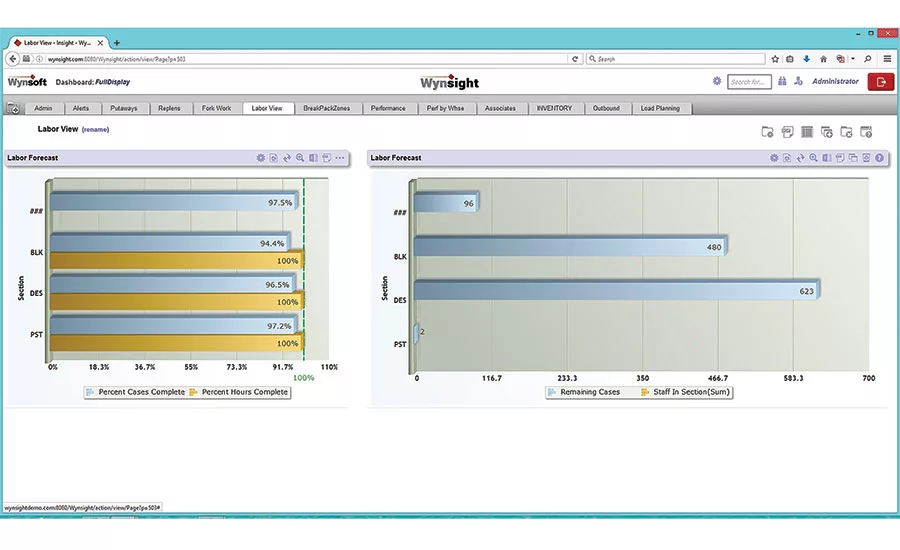
Balancing staff loads is not a one-and-done deal. It is something that must happen in real time based on knowledge of what resources are available, where they are needed and what will be demanded of each, as far into the future as possible. Unless a WES solution is capable of accepting and analyzing data from disparate integrated solutions, regardless of who initially implemented the solution, it is very difficult to assimilate useful information in a reasonable amount of time to make informed business decisions. This is exactly where predictive analytics come into play. Predictive analytics, as part of a WES solution, can examine key performance indicaors (KPIs) and results from all pieces of the WES, such as the warehouse control system (WCS), the enterprise resource planning (ERP) system and the warehouse management system (WMS) to provide actionable data. For example, Figure 1 shows a typical labor forecast for the warehouse section of a distribution center. It shows how much work is forecast, how much has been completed and what is left to be done. This predicts a potential problem situation in that most units have not completed their assigned projects but have expended the hours allocated. Since these data originated from disparate systems, they could not have been analyzed and presented if the WES solution did not include software that could accept and analyze data from multiple sources.
When confronted with such situations, the software assists with analyses that can help determine the root cause of issues. One large distribution center that was missing an inordinately high volume of promised ship dates, for example, used data from its WES to identify the cause. An analysis of data stored in the system revealed the temporary misplacement of some orders that were misplaced in a large value-added-service (VAS) area, where employees inserted flyers and coupons into outgoing orders. The analysis showed that volume surpassed the number of people available to complete the tasks, and orders were falling through the cracks. Modeling the process in the software helped predict the number of additional staff that would be needed to meet ship dates, and the problem was solved.
Space Allocation
Because there is a finite amount of space available in any warehouse, a WES can also help coordinate with other departments to balance space needs in real time. A batch-picking operation involving an automated storage and retrieval system (ASRS), for example, would require a buffer space to receive the order when it arrives. If, however, no space is available when the picked order arrives, the process would come to a halt. Better analysis of the data would flag overcommitment of space so that buffer capacity could be increased accordingly to prevent disruption.
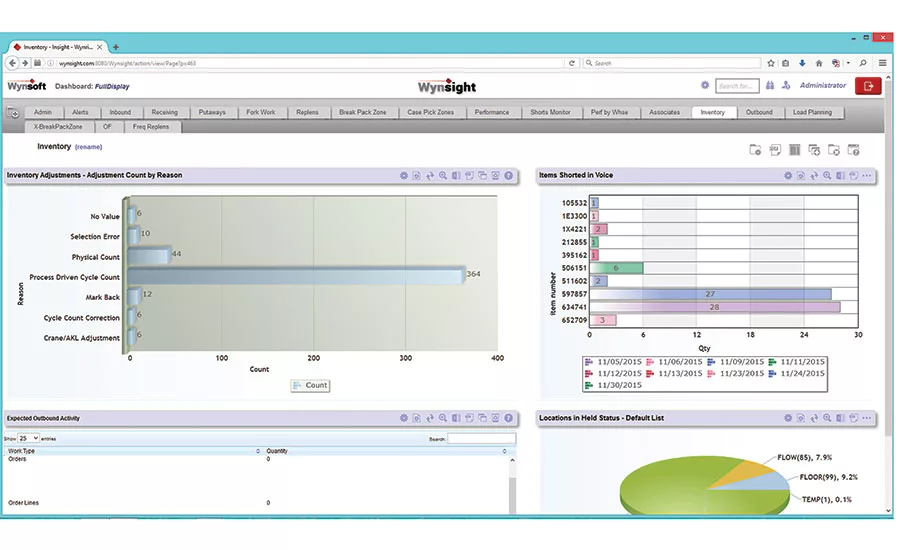
The WES software also contributes to problem resolution by drilling deeper into inventory operations to uncover purchasing management issues that constrain space management. The screen in Figure 2 assists with obtaining an accurate inventory account by showing causes for exceptions that required inventory adjustments. Through further analysis of the data, plant management could determine how each exception might impact space allocation, identify more efficient exception-handling procedures and revise KPIs accordingly. If the analysis reveals that inventory management was already well-optimized, attention might turn to load allocation, physical expansion or other potential variables.
Workflow
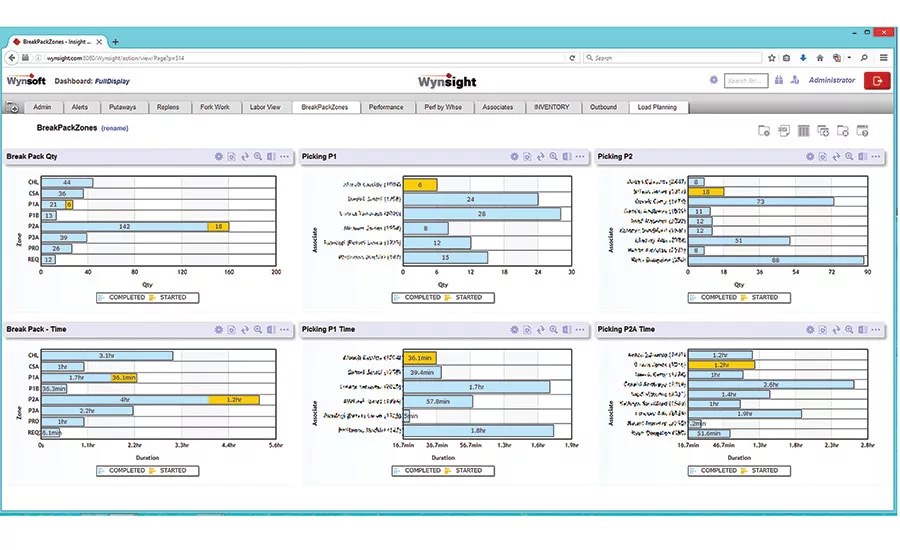
Balancing space, labor and inventory often requires tighter control over the flow of product among people and places. Figure 3, for example, depicts the current performance levels of a distribution center by end-user and work type, revealing where workflow is hanging up or where it is accelerating, enabling process regulation and optimization. From there, it is possible to drill deeper to understand what measures might be needed to determine the right mix of people or resources. Workflow analysis of this sort is the basis for many of the continuous improvement programs that distribution centers around the world are implementing.
Data Integration
One of the key advantages of WES software is that it enables visualization of relationships among variables with granularity in time frames not easily attainable by manual analysis. One retailer, for example, improved picking KPIs on fulfillment of orders for backpacks. Before the analysis, it had stocked backpacks in the back of the warehouse because they are not typically fast movers. Seasonal surges such as when back-to-school specials are in full swing can hurt the typical workflow, however. Analysis of the data suggested that during the peak season, the backpacks should be stored closer to the front, where they are more readily accessible to order pickers.
Looking for quick answers on air conditioning, heating and refrigeration topics? Try Ask ACHR NEWS, our new smart AI search tool. Ask ACHR NEWS
While it may seem that moving the backpacks closer to the front of the warehouse during peak demand periods is common sense, that does not tell exactly when to move them, how far to move them and the impact that each option would have on the picking KPI or the items being moved to accommodate the backpacks. Because WES software models a larger system, it is much easier to weight the systemic impact of incremental modifications.
So far, we have looked only at potential relationships among labor, space allocation and workflow data, but peak distribution center (DC) performance could require analysis and revision of numerous operating variables, as well. The tabs on the software screens in the above examples provide some indication of the key variables that impact operations. In addition to labor, space and workflow, other areas a WES can help manage are the following:
• Alerts to potential work stoppage;
• Putaways;
• Replenishments;
• Backfill & Restocking;
• Fork work;
• General performance of labor;
• Performance by warehouse to compare against; and
• Outbound shipments versus expectations.
With so many categories of data, a potentially infinite number of possible relationships can impact DC performance. Identifying the kinds of information that any company should be tracking and analyzing begins by with reviewing the needs of the decision-makers in your center in the context of their operational KPIs.
Who Needs Predictive Analysis?
Modern WES must allow for customization of screens and dashboards to meet the needs of the full cross-functional team that supports a company’s supply chain. Therefore, the solution must be malleable to provide the correct data to the correct person in time to take corrective actions. Operators of conveyors and ASRS systems typically need software that runs pretty much invisibly but alerts IT, maintenance or other support functions of throughput problems so they can be corrected.
Floor managers and supervisors need the ability to monitor the flow of the systems for which they are responsible. They also need ready access to everyone’s KPI/metrics so they can monitor
progress and adjust actions in time to stay on course.
DC managers need help identifying opportunities to tweak machine, labor and flow that will lead to incremental gains in productivity.
Logistics managers need to understand building-to-building metrics that can point to potential areas of improvement.
Senior management needs to be able to see trends that impact top-level KPIs that gauge achievement against top-level strategic objectives such as profitability, space utilization or throughput.
Setting KPIs
Utilizing KPIs to their fullest potential for even a small warehouse can consume more time and resources than the final benefit justifies. The solution is to design the WES around specific KPIs, most of which can be classified as reporting, flow analysis or reconciliation between planned and executed events. These, of course, will vary significantly from company to company, but there are certain commonalities within industries.
• Retail KPIs — Retailers typically need regular reporting of picking, lines/hour receiving, stocking, packing and shipping, which they often measure on traffic flow. The KPIs might be built around cross docking and carton reconciliation performance or on container and item movements, such as touch points per shelf keeping unit (SKU) or numbers of less-than-truckload (LTL) parcels handled.
• Manufacturing KPIs — Manufacturers might use their WES to build labor and machine production statistics reports. They might also use them to model workflow and inventory, reconcile lots and material shortages or for contingency planning.
• E-commerce/DTC — Online merchants use WES to calculate small parcel handling margins, helping them understand exactly what it costs to handle and ship a package. They use them to shop for the best rates and calculate time to ship, so that customers will know when to expect goods to arrive. Systems also help consolidate orders, track carton status and issue timely alerts.
• Food & beverage — Centers that handle perishable food and beverages will have specialized reporting needs in inventory and stocking activity. This also contributes to the need for timely and precise wave, route and buffer management, carton tracking; and reconciliation.
• Third party logistics (3PL) — For third-party logistics managers, transportation tracking information can be primary, followed closely by labor management and billing.
Do You Need a WES with Predictive Analysis?
Determining whether you need warehouse execution software is a chicken-or-egg situation. Some of the ways in which predictive analytics can benefit your operations may not become apparent until you actually set up and run some of the analyses. How you answer the following questions, however, might help you determine whether predictive analytics software can help improve your operation:
1. Are there industry trends — such as changes in consumer buying practices — that are requiring new modes of operation?;
2. How does your company compete? Is it the low-cost provider? Fastest shipper? Most reliable? What are the trade-offs?;
3. Is your DC performing at peak potential? Do you know where flow is impeded? Do you know which lines are most efficient?;
4. Do your operators, managers and other stakeholders have the information they need for optimal decision making? What would they say?; and
5. Is any of the above information available at your fingertips without an inordinate amount of digging or time to produce?
When evaluating your facility — whether you determine you are in need of adding a VAS system to handle kitting or tagging requirements or if adding a unit sorter or an ASRS [automated storage and retrieval] system is in order — make sure you choose an integrator with the ability to integrate the best solution, and make sure it includes a top layer of software capable of communicating with all aspects of your operation.
If your analysis tells you there is room for improvement, evaluating warehouse management may be an area of improvement that can pay for itself many times over, first by helping you determine where the trouble spots are and then by helping you automate the workflow needed to eliminate them.
Looking for a reprint of this article?
From high-res PDFs to custom plaques, order your copy today!


