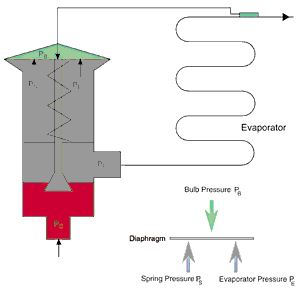

Three forces are at work within a TEV (Figure 1). In the valve-opening direction, bulb pressure acts on the diaphragm from above. In the valve-closing direction, both spring pressure and evaporator pressure oppose it, acting on the diaphragm from the other side.
When the load on an evaporator changes, the change in sensing bulb pressure (PB) is transmitted through the capillary tube to the space above the TEV's diaphragm. The diaphragm moves in res-ponse; its motion is transmitted by one or more pushpins to the orifice, which opens or closes to cause a corresponding change in refrigerant flow through the valve.

Superheat Affects Valve Actions
Friction, which results in resistance to the movement of the pushpins, causes hysteresis.
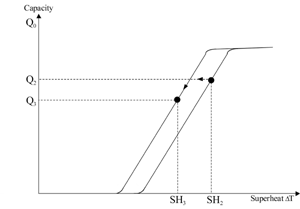
Figure 2 models the action of a typical TEV. Although valve response is often represented by a single curve, there are actually two, one for valve opening and the other for closing. The area between the two curves is called the hysteresis band.
Let's say we're on the valve opening curve and the load on the evaporator increases, in turn requiring an increase in cooling capacity (Figure 3). The superheat increases, raising the bulb pressure, which opens the valve. The capacity delivered by the valve changes almost instantly.
If we're on the opening curve and the load decreases, the story is different (Figure 4). Before the valve can start closing, superheat must decrease by the distance between the opening curve and the valve closing curve. With any smaller decrease in superheat, we will still be in the hysteresis band, and the valve will not begin to close. Only after reaching the closing curve is the valve ready to begin closing with any further decrease in superheat.
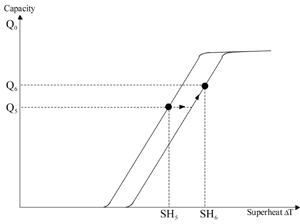
The relationships between superheat changes and valve actions are similar if we start on the valve closing curve. There, a decrease in flow through the valve occurs without hysteresis (Figure 5), but since an increase in refrigerant flow requires crossing the hysteresis band, superheat must increase by the distance between the two curves, overcoming the valve's hysteresis (Figure 6). Capacity can only increase on the opening curve, and can only decrease on the closing curve.
Hysteresis can't be computed. Valve manufacturers make laboratory measurements over the valve's capacity range to determine the curves for a given design. At Danfoss, this is done using precision automatic measuring and recording instruments. The process takes place under standardized, controlled conditions.
The design of a valve determines its internal friction, and therefore its hysteresis. Valves with low internal friction have correspondingly low hysteresis. But if there were no hysteresis at all, the opening and closing curves would become one, and the valve would react instantaneously to any change in load, even extremely small changes.
While that might sound great at first, it would cause the valve to be too sensitive. The system could then become unstable, with the valve possibly going into a hunting mode.

What Happens inside the Evaporator?
Figure 7 shows the behavior in an evaporator at a given capacity. Given a negligible pressure drop across the system, if we place temperature probes (T1 and T2) at the inlet and outlet, we can determine the superheat across the entire evaporator (T2-T1).
By moving T2 closer (to T2A), the temperature difference drops as we get closer to the liquid front.

The evaporator is most efficient at the MSS point because this is the point at which all of the refrigerant has finished evaporating and the evaporator is fully utilized.
A curve can be graphed by determining the MSS point at different loads. This is shown by the red curve in Figure 8. For every evaporator, the MSS curve characteristic is unique. This curve can have many shapes, as it is primarily a function of evaporating temperature, airflow, and coil design.
The gray area to the left of the MSS curve represents an unstable zone where liquid and gas coexist. When a system operates within this region, liquid refrigerant escapes at the evaporator outlet and overall system efficiency falls. The further we go into the unstable zone, the greater the potential for liquid slugging, which in turn leads to serious compressor damage.
To the right of the MSS curve there is only superheated gas. Moving too far into this region also reduces system efficiency because the evaporator is not being fully utilized.
In practice, achieving minimum stable superheat for optimum system performance may involve first decreasing the TEV's static superheat setting until the system begins to become unstable, then slightly increasing the static superheat until stability is just reached.

Putting It All Together
A TEV is a proportional control device. That means capacity changes are directly proportional to changes in superheat.
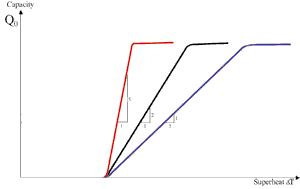
Figure 9 shows the characteristics of three TEVs. To simplify the diagram, each characteristic is shown as a single curve. The slope of the characteristic is called its gain. The greater the gain, the steeper the valve characteristic, and the bigger the capacity change for a given change in superheat. Each of the curves in Figure 9 shows the capacity increase for a 1° change in superheat.
In an actual operating system, a TEV's gain will change with variations in subcooling and pressure drop across the valve.
Figure 10 shows how three valve characteristics with different slopes "fit" an evaporator characteristic. Remember that the evaporator characteristic we want the valve to fit is to the right of the unstable zone, but as close to it as possible. It's the valve closing curve that's closest to the evaporator characteristic. The range shown in green is the system's most-efficient operating range.
It is important to take the hysteresis band into consideration because the valve opens in the stable area where there is only gas at the sensing bulb, and closes just before the system becomes unstable. In the first two examples in Figure 10, the valve closing curves are completely outside the unstable zone. Due to the slope of the characteristics in those examples, there is a comparatively large area of high efficiency (green). In the third example, due to a steeper characteristic slope, the upper portion of the closing curve falls inside the unstable zone, and the high-efficiency range is much smaller.
Knowing how hysteresis affects valve operation, how refrigerant quality changes in an evaporator, and how valve and evaporator characteristics need to match will give a service technician a base of understanding that will make it easier to tune refrigeration systems for optimum performance at minimum stable superheat (MSS).
Christensen is an application engineer and Robinson is market communication manager, Air-conditioning and Refrigeration Division, Danfoss Inc., Baltimore, MD. For further information, e-mail maxrobinson@danfoss.com, or visit the company's website at www.danfoss.com.

Hysteresis Defined
According toWebster's Seventh New Collegiate Dictionary,hysteresis(hys-ter-e-sis) is a retardation of the effect when the forces acting upon a body are changed (as if from viscosity or internal friction); esp. a lagging in the values of resulting magnetization in a magnetic material (as iron) due to a changing magnetizing force.The concept can be illustrated by the following example. If you push your fist in bread dough, it will yield. When you release, it does not spring back completely. Therefore, it is exhibiting hysteresis in a broad sense. The term, however, is most commonly applied to magnetic materials.
Publication date: 01/29/2001

Report Abusive Comment