Evaluating A Fan's 'Efficiency Impact' From A Collective Perspective
Use an unorthodox comparison to take a fresh look at the savings that could be hiding out in all those air handlers.
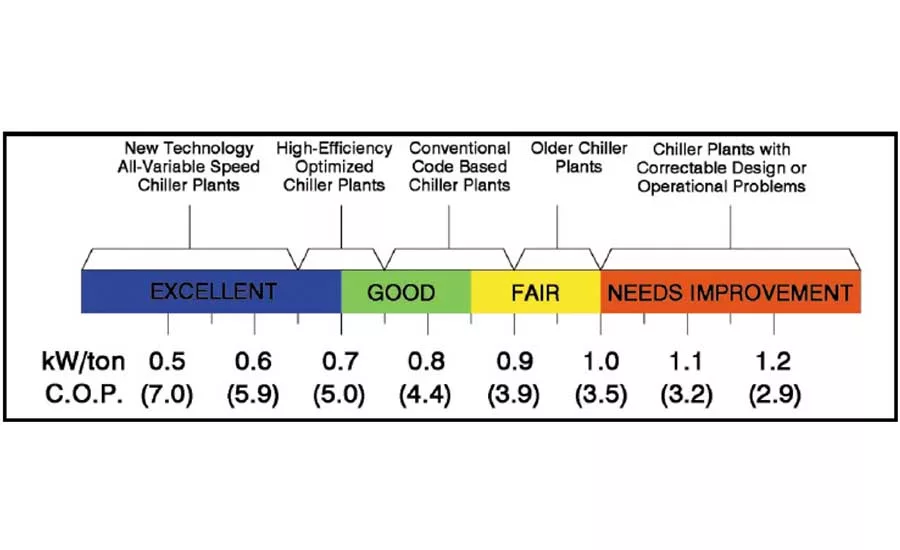
FIGURE 1. Chiller plant efficiency in IPLV (kW/ton)1.
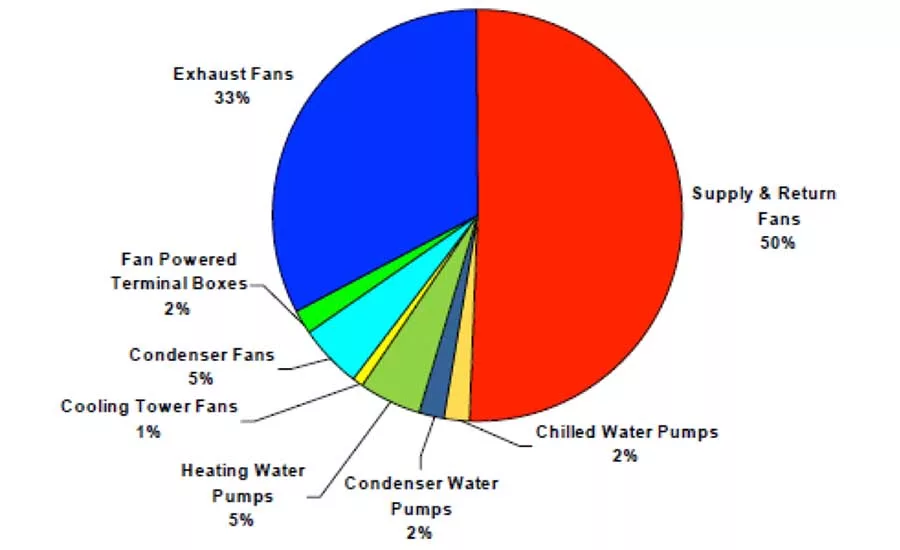
FIGURE 2. Energy use by auxiliary HVAC equipment category (DOE).
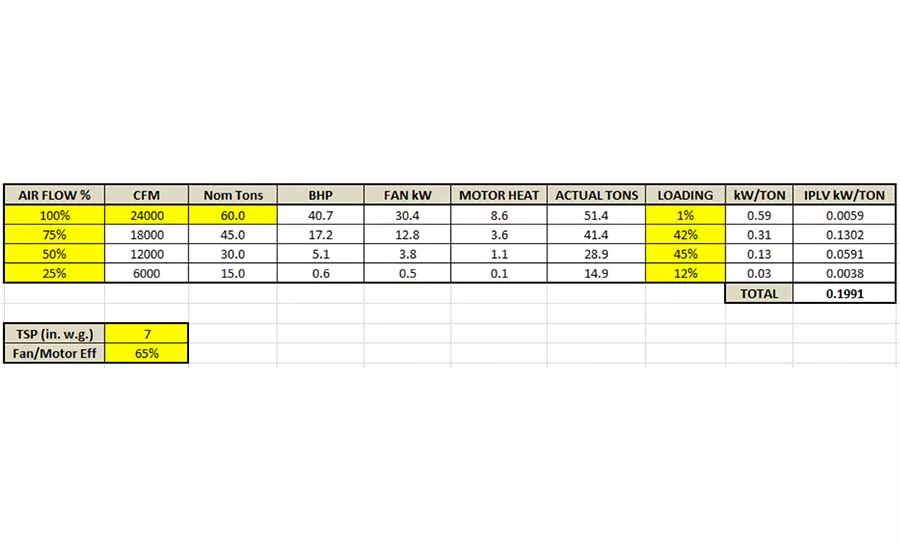
FIGURE 3. Fan part-load IPLV model.
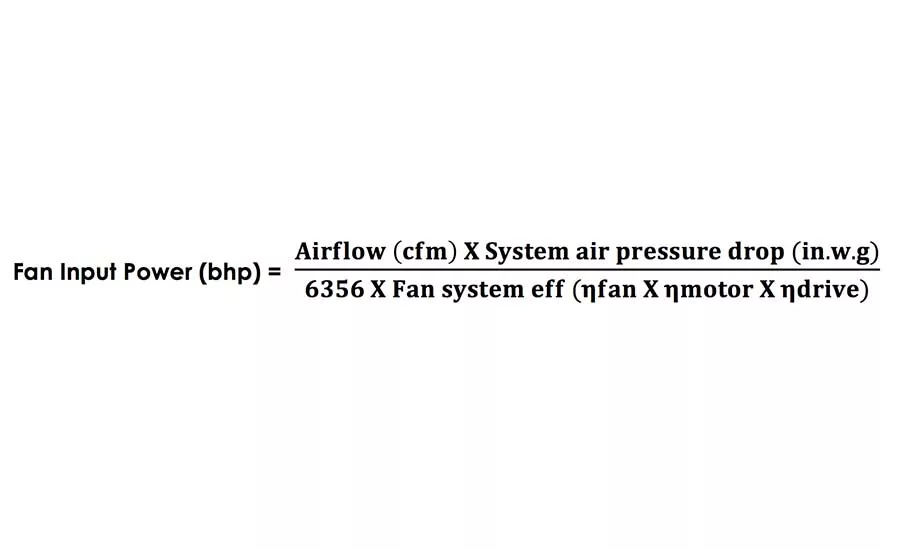
FIGURE 4. Fan input power equation.
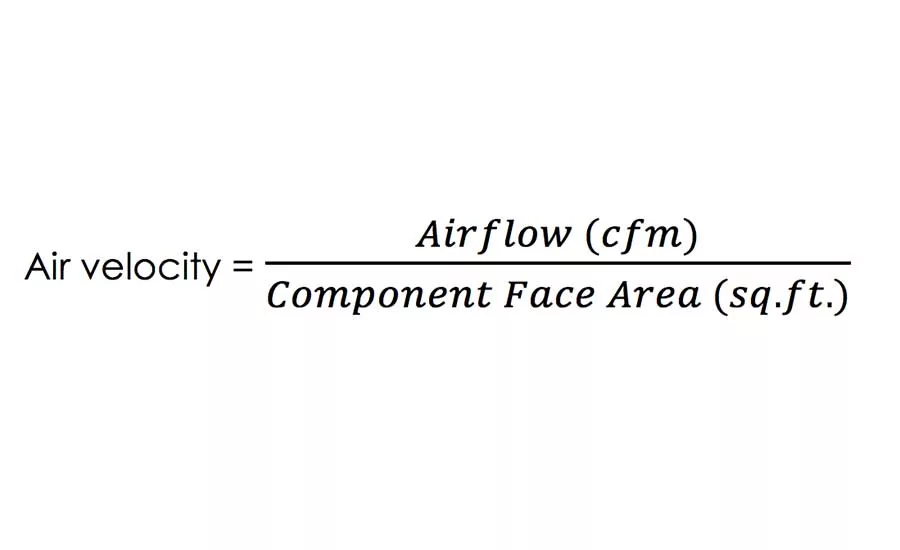
FIGURE 5. Face velocity equation.
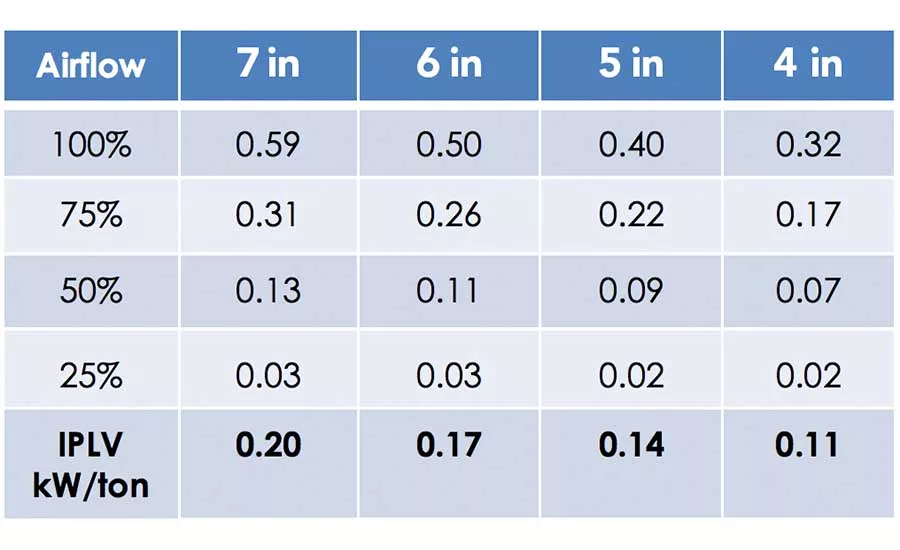
FIGURE 6. AHU fan performance (kW/ton) with reduced pressure drop.
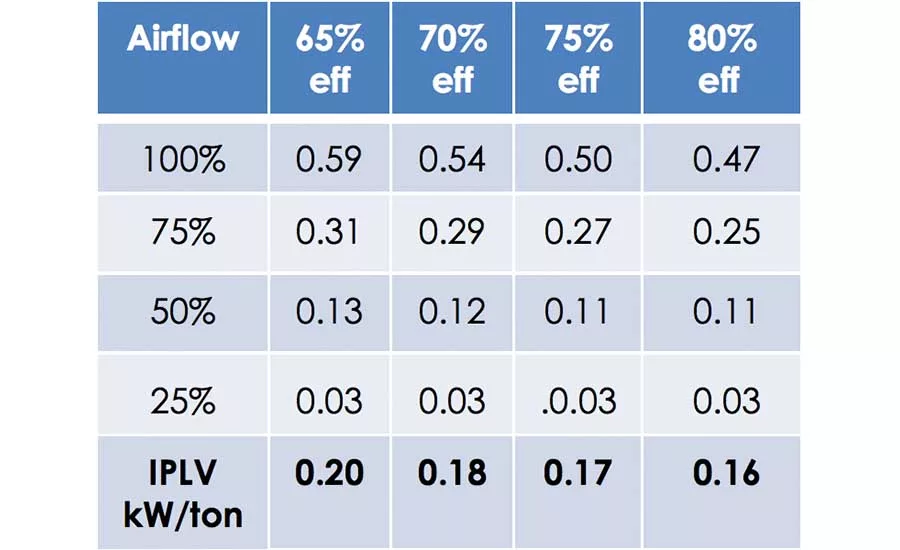
FIGURE 7. AHU performance (kW/ton) with increased fan efficiencies.
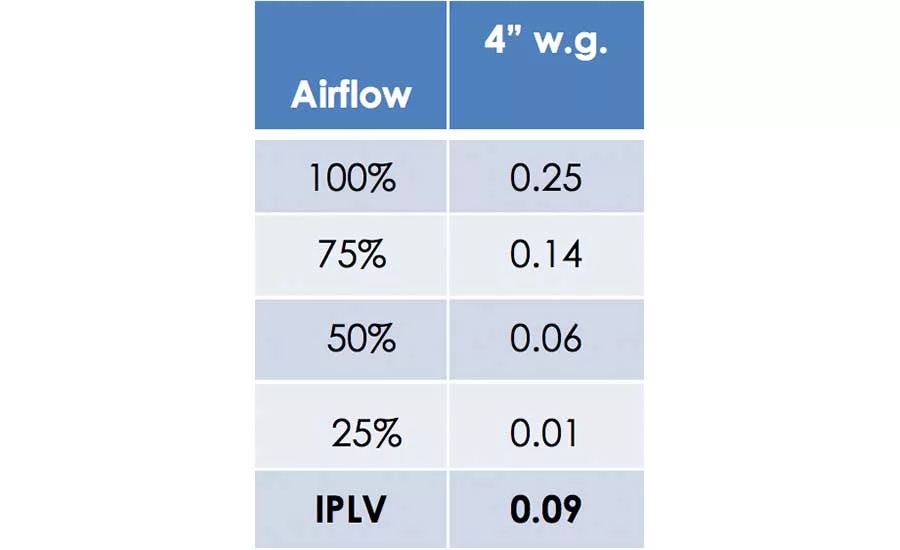
FIGURE 8. Fan performance (kW/ton) optimized.
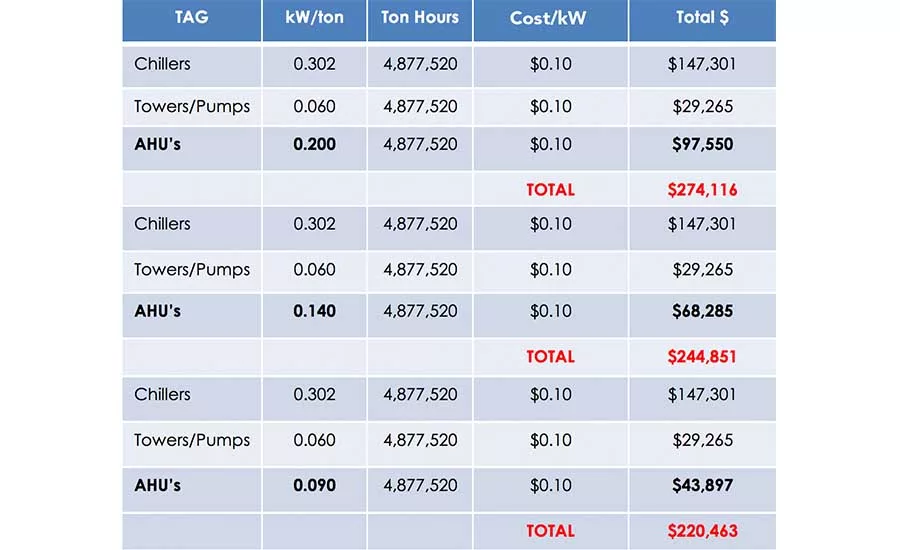
FIGURE 9. Building cooling system energy costs with improved AHU efficiency.
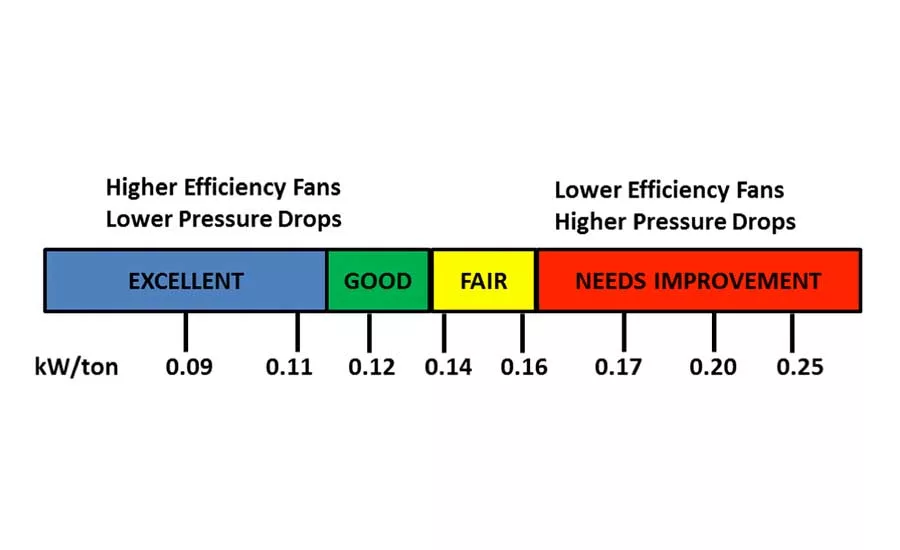
FIGURE 10. AHU efficiency IPLV (in kW/ton)
Chillers have always been a popular choice to air condition large commercial buildings that are, by their nature, energy intensive. To service these types of buildings, a single 1,200-ton centrifugal chiller could require a compressor motor in excess of 900 hp. Engineers usually focus on a chiller’s efficiency (and rightfully so) as it often requires the single largest motor installed in a building. However, it is important not to become so centered on this single element of design that one loses sight of the energy use contributed by other HVAC components.
Article Index:
Individual AHU fan motor brake-horsepower (bhp) can be orders of magnitude less than that of the chiller. Therefore, the energy impact attributed to these smaller motors may be considered comparatively unimportant. It can also be difficult for engineers to gauge the immediate energy impact that AHUs make based on the way fan energy is typically evaluated in terms of bhp, percent efficiency, or Watts/cfm. While these metrics allow comparison between fans, they are seemingly disparate to the way chiller efficiency is evaluated.
This article will assess both chiller and AHU energy consumption using a kilowatt per ton (kW/ton) metric for collective comparison. While this evaluation methodology isn’t typically used for fans, it provides a unique “side by side” look that may provide a more relative indication of the importance AHU fan efficiency plays in overall building energy consumption.
Central Plant Efficiency
Since a chiller will operate at varying capacities in response to the buildings air conditioning load, common values such as Energy Efficiency Ratio (EER) or Coefficient of Performance (COP) which define full-load energy use are not considered an ideal way to analyze life-cycle chiller performance. Instead, the Integrated Part Load Value (IPLV) was developed by the Air-Conditioning, Heating and Refrigeration Institute (AHRI) and is identified in energy codes such as ASHRAE Standard 90.1.
These IPLV values are a measure of energy consumption made in kW/ton and are calculated by dividing the chiller electrical input in kW by the chiller capacity in tons of cooling. This metric can then be used to make various chiller efficiency comparisons (one to the other) much in the same way cars are compared on their MPG rating. Standard IPLV values are calculated using the formula below:
IPLV = 0.01A+0.42B+0.45C+0.12D
Where:
A = COP or EER @ 100% load @ 1% of operational hours @ 85°F ECdWT
B = COP or EER @ 75% load @ 42% of operational hours @ 75°F ECdWT
C = COP or EER @ 50% load @ 45% of operational hours @ 65°F ECdWT
D = COP or EER @ 25% load @ 12% of operational hours @ 65°F ECdWT
It should be noted that IPLV is only an approximate, single-number generalization of part-load performance. A full discussion on IPLV is beyond the scope of this article.
Today’s high-efficiency water-cooled centrifugal chiller can be equipped with a VFD that can produce tremendous energy savings by reducing the bhp requirements of the large chiller motor at lower cooling capacity and associated ECdWT. Some chillers may be capable of obtaining IPLV values as low as 0.30 kW/ton or less (smaller numbers equaling greater efficiency). Figure 1 shows chiller plant efficiencies for a “good-better-best” scenario and includes the energy consumption of chillers, condenser pumps, and cooling tower fans1. These metrics provide the engineer with guidance when striving to design a more efficient chilled water central plant. But what about the impact fan performance plays on the overall HVAC systems energy footprint?
What about the Air Handlers?
For every chiller, there may be dozens of AHUs installed throughout the building. A report published by the Department of Energy (DOE), Energy Consumption Characteristics of Commercial Building HVAC Systems, focuses on the energy required to distribute heating and cooling within a building, reject to the environment the heat discharged by cooling systems, and move air for ventilation purposes. It demonstrates that about 85% of the buildings “parasitic” energy use may be associated with the operation of fans which supply or exhaust air to or from the space.
Figure 2 shows a breakout of this energy use by equipment type. Supply and return AHU fans, and exhaust fans used for ventilation, account for 83% of this energy. This large energy use is due to the fact that fans are associated with almost every system type defined in the report. The study states “air is an inherently inefficient heat transfer medium, typical air distribution design practice involves considerable pressure drop for filtration, cooling and heating coils, terminal boxes, and diffusers, and many of these fans operate at 100% power during all building occupied periods.” From this information one may concluded that high-performing air handling systems (fans in particular) may contribute to a significant reduction in overall building energy expenditures.
Leveling the Playing Field
Using a common metric of kW/ton may be a more straightforward way to provide a side-by-side comparison of both chillers and AHUs, indicating in common terms how a performance change in either will impact overall HVAC system energy use. The steps necessary to establish a kW/ton metric for an AHU fan is shown below:
1) Establish AHU cooling capacity and airflow requirements.
2) Using the equation below, calculate AHU fan brake horse power (bhp) requirements.

3) Using the equation below, calculate the fan kW requirement.
Fan kW = bhp X 0.746 kW/bhp
4) Using the equation below, calculate the derating of AHU cooling capacity (in tons) associated with fan/motor heat.
Fan heat = fan kW ÷ 3.517 kW/ton
An example problem is outlined below:
1) For a 1,200-ton chilled water project using 20 equally sized AHUs, with each AHU sized to deliver 60 tons at 24,000 cfm (based on nominal 400-cfm/ton).
2) The fan input power (bhp) required for a single 60-ton AHU delivering 24,000 cfm of air at 7 in w.c. airside pressure drop with a 65% efficient fan would be:

3) The fan kW requirement for a 41-bhp fan would be:
31 (kW) = 41 (bhp) X 0.746 (kW/bhp)
4) Derating the cooling coil tonnage due to fan heat would be:
9 (tons fan heat) = 31(kW) ÷ 3.517 (kW/ton)
To further establish the AHUs energy consumption in kW/ton, the following procedures are followed:
a) Determine actual capacity of cooling coil due to derating for fan/motor heat:
60 (tons nominal capacity) – 9 (tons fan heat) = 51 (tons actual capacity)
b) Determine final AHU energy consumption in kW/ton:
31 (kW) ÷ 51 (tons) = 0.60 (kW/ton)
One immediate observation that can be made is that the 20 AHUs in this example will require a total 820 bhp of full-load motor capacity at 0.60 kW/ton. The 1,200-ton high-efficiency chiller, selected at .509 kW/ton full-load, will require a single motor sized for 611.3 kW ÷ 0.746 kW/hp = 819 bhp. The installed motor loads are equal, but the AHUs carry a full-load kW/ton penalty 15% higher than that of the chiller.
But HVAC systems may not often (if ever) operate at full-load conditions. As stated earlier, chilled water requirements can be influenced by the building air conditioning load, which allows for reductions in chiller capacity and improved part-load energy performance. At part-load conditions, AHU fans can move less air to satisfy space comfort requirements, with significant reductions in AHU fan energy being possible if also equipped with VFDs. The impact of part-load energy performance of the fans should be analyzed similarly to that of the chiller.
Figure 3 applies IPLV type modeling (similar to a chiller) to the individual AHU fans calculated in the example above. The resulting 0.20 kW/ton IPLV is a substantial two-thirds that of the chiller which is rated at 0.30 kW/ton IPLV. (Note that for simplicity, efficiency has been assumed constant throughout the fans full operational range; in reality, this may not be the case). It should also be noted that evaluating a fan at 25% minimum airflow may be below the air quantity required to meet ventilation needs or provide stable AHU operation. Many VAV systems are set up for minimum airflows in the range of 30% to 40%. Therefore, fan speed reductions may not follow a matching load profile with that of the chiller.
The importance of fan energy consumption on overall HVAC system operational costs should also consider that chillers may be staged down or shutoff during fall and winter seasons, while the same may not be true of AHUs and fans. Depending on geographic location, the airside components (and their associated fans) may run more hours per year than the chillers do. This would most likely be due to the fans operating to supply heated air during heating season or to meet airside economizer and ventilation requirements. These two scenarios could occur without need for mechanical cooling (and therefore operating chillers). This may result in fan energy being a very large portion of overall HVAC system energy use, regardless of efficiency.
Realizing Opportunity
Air is a wasteful mechanism for transporting Btu, and every cfm of air delivered by an AHU results in parasitic energy penalties. Limiting the impact of this loss requires moving no more than the volume of air necessary. Establishing airflows should be based on a careful analysis of the building load requirements where maximum cooling airflow is the volume of air required to meet space conditioning needs at cooling design, and minimum airflow may be based on the volume of air required to comply with local codes and standards for air change and/or ventilation.
Our earlier example (Figure 4) was used to estimate AHU fan input power. Decreasing fan bhp, and therefore its energy consumption, requires manipulating one or more of the equation variables. Once airflow has been established, air pressure drop can be reduced or fan system efficiency increased (or both) in order to improve AHU energy performance.
Reducing System Pressure Drop
It’s not uncommon to see large building air distribution systems (AHUs and ductwork) designed for air pressure drops over 4 in w.g., which can result in high fan energy consumption. Significant savings may be attributed to the designer’s ability to reduce this pressure drop. One way to accomplish this is by designing AHUs and duct systems to operate at reduced air velocities. Traditional AHU design may result in air velocities of 550 fpm or more across cooling coils and filters, while operation at 275 fpm or less might be acceptable. Lowering air velocity through AHUs or ductwork will reduce the component pressure drop by approximately the square of the velocity reduction, assuming fully turbulent airflow. The equation in Figure 5 can be used to calculate air velocity.
Based on fan affinity laws, a 50% reduction in air velocity would theoretically produce a 75% reduction in pressure drop, with a corresponding 87% reduction in motor bhp requirements. Figure 6 shows the impact on AHU energy consumption in kW/ton with constant fan efficiency (65%) accompanied by a reduction in system air pressure drop.
Increasing AHU Fan Efficiency
Choosing the correct fan type, configuration, and its operational point on the fan curve is a key factor to enhanced AHU energy performance. A backward curved fan (impeller) can use up to 15% less power than a forwarded curved fan at the same airflow and pressure requirement. Forward curved fan peak efficiencies are in the range of 65% to 70%, while a backward curved fan may offer peak efficiencies between 75% to 80% or more. Also, larger fan and motor combinations are typically more efficient than smaller ones. Figure 7 shows the impact on AHU fan energy consumption in kW/ton with improved fan efficiency at a constant 7 in w.g. system pressure drop.
While more efficient fans and (or) reducing air system pressure drop may increase equipment first cost, this may be offset by the reduction in size of the fans and motors required. Also, this can influence specific duct construction requirements (low vs. high pressure) and perhaps eliminate the need for sound attenuators2. Ultimately, lowering energy consumption may come from the combination of a higher efficiency fan operating at a reduced air pressure drop. Figure 8 shows the impact on AHU energy consumption in kW/ton with an optimized air system designed at 4 in w.g. pressure drop using an 80% efficient fan.
Tying it all Together
Figure 9 evaluates the improvement to overall cooling energy cost that is derived by simply improving AHU fan energy performance. By increasing AHU fan performance from an IPLV of 0.20 kW/ton to that of 0.09 kW/ton, fan operational costs are more than cut in half. Once analyzed, it then becomes a matter of determining if these improvements in efficiency are economically feasible, typically vetted through a lifecycle analysis along with the HVAC system budgeting and bid process.
Figure 10 shows a scale of good, better, best fan performance (similar to that for the chiller plant shown earlier) which may help engineers target comparable improvements in AHU fan energy efficiency.
Owners and design professionals realize that it pays dividends to invest more upfront cost in energy-efficient design with building efficiency initiatives now considered as a bona fide financial investment. Annual returns on these high-performance system designs are outweighing those of the recent stock market. A more straightforward method of evaluating the impact that both chiller and AHU energy consumption play may be helpful to design professionals in the early stages of system analysis. Using a collective measure of comparing motor-driven equipment may provide a valuable indication of the importance each plays in overall building energy consumption.
References:
1 ASHRAE Journal, September 2001: All-Variable Speed Centrifugal Chiller Plants, Thomas Hartman, P.E.
2 Laboratories for the 21st Century: Best Practices, U.S. Department of Energy, DOE/GO-102005-2042 February 2005.
For full article in pdf form, read here.
Looking for a reprint of this article?
From high-res PDFs to custom plaques, order your copy today!