The X-Factor: Y Should U Care?
Unprecedented vendor-neutral data has been brought down from the mountain on a digital tablet.

TABLE 1. ASHRAE 2011 Thermal Guidelines (I-P Units) (copyright and courtesy of ASHRAE).
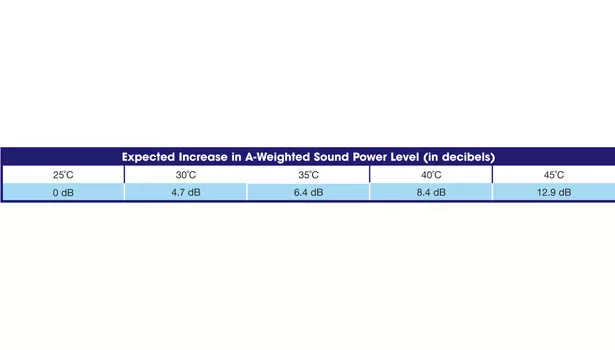
TABLE 2. Expected Increase in A-Weighted Sound Power Level (copyright and courtesy of ASHRAE).
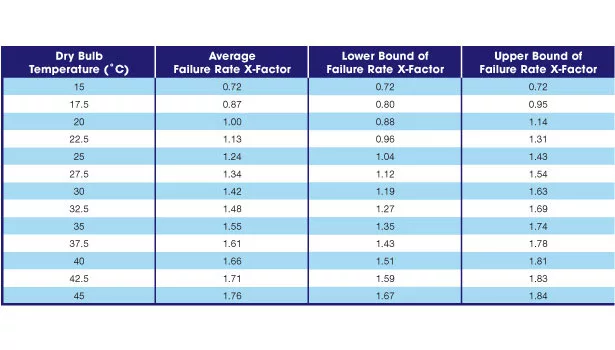
TABLE 3. Relative hardware failure rate x-factor for volume servers as a function of continuous (7 days x 24 hours x 365 days) operation air inlet tem-perature (copyright and courtesy of ASHRAE).

TABLE 4. Time-at-temperature weighted failure rate calculation for IT equipment in the city of Chicago (copyright and courtesy of ASHRAE).
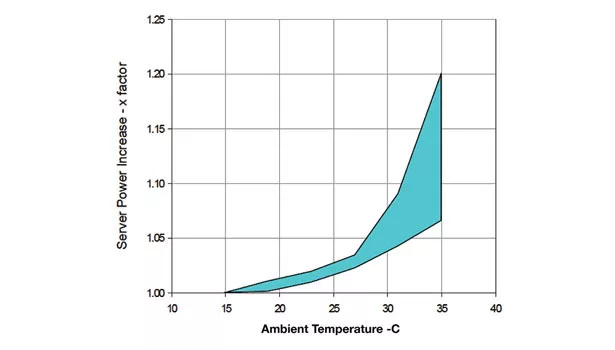
FIGURE 1. Server Power Increase vs Ambient Temperature for Classes A2 (copyright and courtesy of ASHRAE).
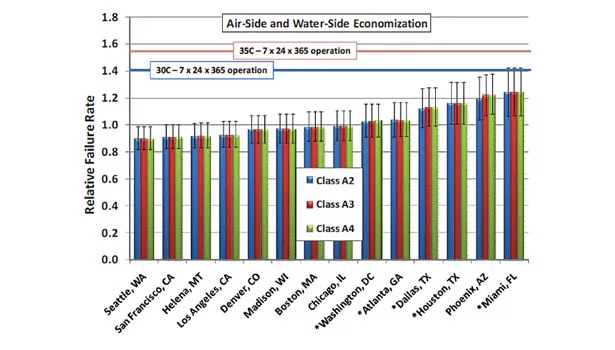
FIGURE 2. Failure rate projections for air side economizer and water-side economizer for selected U.S. cities. Note that it is assumed that both forms of economizer will result in data center supply air at 1.5°C (2.7°F) above the outdoor dry bulb (copyright and courtesy of ASHRAE).
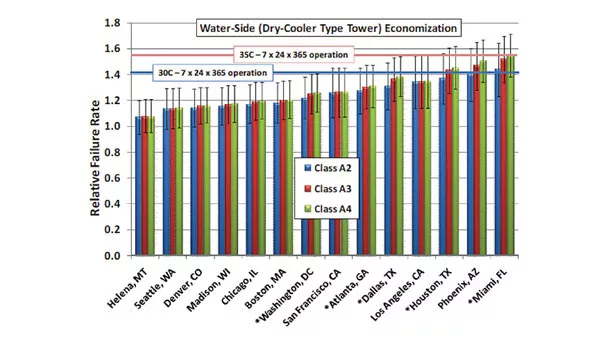
FIGURE 3. Failure rate projections for water side economizer with a dry-cooler type tower for selected U.S. cities. Note that it is assumed that the economizer will result in data center supply air 12°C (21.6°F) above the outdoor dry bulb (copyright and courtesy of ASHRAE).
MISSION CRITICAL REVELATIONS
TWICE THE PAPER, TWICE THE FUN
- Acoustical noise levels in the data center vs. ambient temperature
- Server power trend vs. ambient temperature
- Server reliability trend vs. ambient temperature
- Server reliability vs. moisture, contamination, and other temperature effects
- And finally, server cost trend vs. ambient temperature
OLD RELIABLE
BLURRED LINES
SURPRISE, SURPRISE
X MARKS (AND DRIVES) THE SPOT
IN CONCLUSION
Looking for a reprint of this article?
From high-res PDFs to custom plaques, order your copy today!


