From Good To Great: Optimizing Your Chiller Plant

In 2009, Texas Woman’s University (TWU) initiated a continuous energy monitoring program using submetering of major components and a Web-based, consultative approach to generate operational savings in the 4,000-ton central chiller plant at its Denton campus. As a result, TWU reduced the operating cost of the plant by $74,061 in 15 months. Within the first 45 days of the start of baseline monitoring and analysis, TWU’s advisors identified inefficiency in the operation of a 1,000-ton VFD chiller — data that the TWU central plant operations team could now see for themselves on their Web-based interface.
Advisors suggested a control strategy modification of the existing BAS, and the operations team agreed. They lowered the entering condenser water temperature (ECWT) from the formerly fixed setpoint of 83°F to a variable setpoint, which is dependent on cooling tower range and wetbulb temperature, with a low of 55° when conditions permit. As a result of this single modification, the cost to operate this chiller was reduced by 24.5%. Operating savings continued to accrue as a result of ongoing monitoring and optimization of the chillers, chilled water pumps, and cooling tower operation.
THE USUAL SUSPECTS
Many central chiller plants were designed and built in the 1980s before energy costs began their steep rise, so there was little concern at the time about energy efficiency and life-cycle cost. Today, many of these existing plants are still being run according to decades-old standard operating procedures (SOPs). Moreover, new plants continue to be designed and run using outmoded, inefficient technology and SOPs even though improved technologies and operating guidelines are available.
Here are a few of the usual suspects in cases of chiller plant inefficiency.
•
Fixed condenser water setpoint. Over the past 20 years, chiller manufacturers have improved heat exchanger efficiency by 25% on average. However, most condenser water systems are still designed at 3 gpm/ton with a fixed condenser water setpoint. As a result, the chiller always operates at design flow regardless of the actual load. If this is a cause of a chiller plant’s suboptimal performance, it may be remedied with a site-specific modification of the BAS control strategy to a variable set point mode and/or variable condenser flow.
•
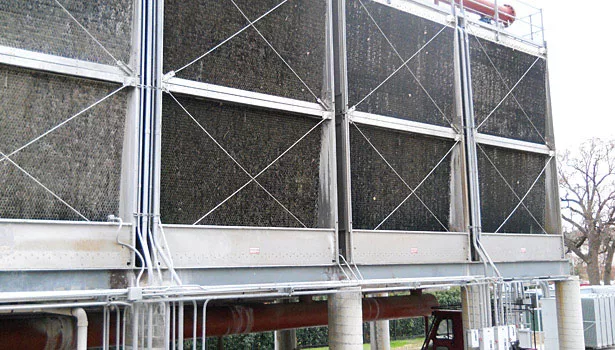
Parallel cooling towers without isolation capability. In the 1980s, plants with more than one cooling tower often were piped in parallel, and many are still designed and operated that way today. The most egregious flaw in these multi-cell configurations is the absence of hot- and cold-deck isolation valves. For example, consider a 3,000-ton chilled water plant with three parallel 1,000-ton chillers (condensers), three parallel 1,000-ton cooling towers (without isolation valves), and three parallel 3,000 gpm condenser water pumps. At one third of the design load, only 3,000 gpm of condenser water would flow over the three cells; however, optimal cooling tower performance requires a constant flow of approximately 9,000 gpm of condenser water over the three parallel towers. Low-volume condenser water flow results in poor distribution of the water flow across the fill, large dry areas, increased energy use by cooling tower fans, and frequent maintenance to remove calcium carbonate (scale) build-up from the cooling tower fill.
Cooling tower performance is an integral part of optimizing any chilled water plant. Not only will optimization save tens of thousands of operating dollars annually, but it will also reduce maintenance cost and, possibly, premature failure of the cooling towers. If this is a cause of suboptimal performance in a particular plant, it may be remedied with cooling tower isolation valves and a modification of the BAS control strategy.
•
Pressure drops, turn-down ratio. Other significant factors can negatively affect life-cycle costs of a new or retrofitted chiller plant. One is the failure to consider the impact on pump energy consumption of variations in chiller pressure drops, which vary among manufacturers — even among models from the same manufacturer. Another is the turndown ratio of chilled water and condenser water in variable flow systems.
A SOLUTION: CONTINUOUS MONITORING,
OPTIMIZATION, AND VERIFICATION
Through experience, chiller plant managers and operators may already suspect that their plants are performing at a suboptimal level due to these and other design and operational factors. However, the usual suspects must be thoroughly investigated before making changes to the BAS control strategies or replacing components. A trial-and-error approach is time-consuming, costly, and likely to be ineffective in the long run.
However, reliance on the proprietary BAS alone is not the answer. Like every human being, each plant has its own unique DNA. Consequently, there is simply no single black box, proprietary software, “one size fits all” solution, or controls brand that can achieve optimal efficiency. Were the controls company to try to customize its BAS to properly optimize a specific plant, it would have to tailor its software to that plant. This approach would take many labor hours to collect and analyze data and to modify the software — and not once, but repeatedly. In some cases, major capital would be required to reconfigure existing plant hardware and layout in order for a specific system to function as designed. Even so, the typical BAS trend-logs individual points, which is at best a retrospective approach. It also requires an analysis of these data in a spreadsheet by an experienced chiller plant operations engineer.
There is a cost-effective alternative that does not require the purchase of proprietary devices and/or software, and yields real-time operating data: continuous energy monitoring, optimization, and verification. In this process, plant operations advisors perform an on-site survey of the existing plant to identify the equipment and existing operating conditions, including potential areas for improvement. The owner makes a minimal capital investment in the installation of industrial flowmeters and electric meters on every major component of the chiller plant — fundamentally, every chiller, every pump, and every fan — and Web-enabling the existing BAS.
The process is designed to collect the metering and submetering information from the BAS (which does not affect the performance of the BAS), store it, and display historic and real-time data to the owner in a multi-level interface that is user-friendly and simple to navigate. From their offices, chiller plant operations advisors continuously monitor these data in real time. The data are collected for a period of time to establish a baseline, which enables the advisors to analyze performance and suggest modifications to BAS control strategies to improve efficiency. Ongoing data collection and monitoring documents the results and verifies any changes made.
The energy efficiency of a chiller plant can be improved by as much as 5% to 30% through this systematic process. The savings become available to the owner to redirect in the facility as needed, including operational and capital improvements.
TWU: A CASE IN POINT
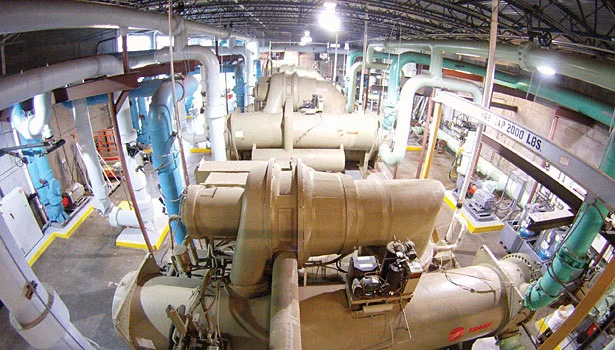
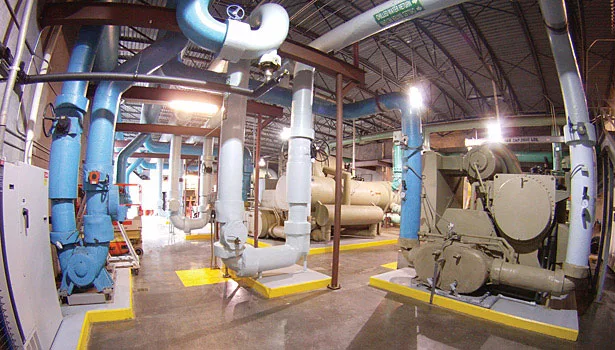
In 2009, TWU initiated a continuous energy monitoring and verification program using submetering of major components and a web-based, consultative approach to generate operational savings in the central chiller plant at its Denton campus. Renovation of the central plant began in 2001 and was completed in 2003. The central plant, currently sized at 4,000 tons with the option of a future redundant 1,500 tons, parallels a 1,000-ton VFD chiller, two 1,500-ton chillers connected in a primary-secondary configuration with three secondary VFD chilled water pumps, three constant-speed primary chilled water pumps, three condenser-water pumps, and four 1,000-ton cooling-tower cells.
As of September 2009, the plant had been operating for almost seven years of a 15-yr, multimillion-dollar performance contract, which had generated significant savings. However, TWU was interested in further improvement with newer technology to increase efficiency.
TWU engaged TDIndustries (a strategic partner of utiliVisor, a continuous energy oversight service), to complete a detailed survey of the TWU Denton central chiller plant and implement continuous energy monitoring, optimization and verification.
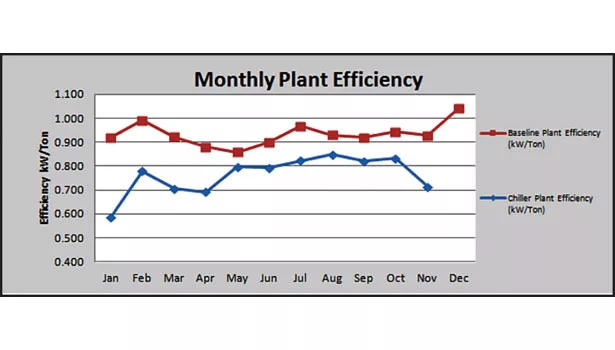
After installation of the metering and submetering devices and web-enabling the plant’s BAS, advisors began a six-month monitoring process to generate an operating performance baseline. However, after 45 days, advisors had already identified operating inefficiencies and suggested an adjustment to one of the BAS control strategies, as briefly noted above.
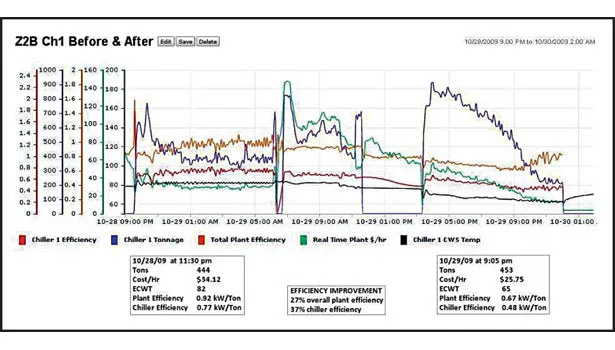
This 1,000-ton VFD chiller had run for six years with a fixed 83°F ECWT. During monitoring, the chiller operating conditions were at 444 tons, 0.77 kW/ton, VFD 52 Hz, 83° ECWT, and the plant at 0.92 kW/ton, at a cost of $34.12/hr. After modifying the control strategy to enable lowering the ECWT when conditions permitted, the chiller then operated at 453 tons, 0.48 kW/ton, VFD 43 Hz, 64° ECWT, and the plant at 0.67 kW/ton, at a cost of $25.75/hr — achieving a 24.4% reduction in cost, a 27% improvement in overall plant efficiency, and a 37.6% improvement in chiller efficiency.
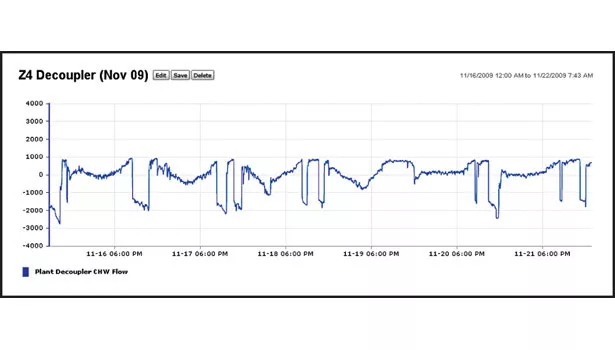
Operating savings continued to accrue monthly and yearly as a result of system optimization. For example, data from the secondary chilled water pump control showed that significant amounts of chilled water were still being “short circuited” through the decoupler. Advisors collaborated with TWU’s plant managers and operators on a plan to convert the existing primary-secondary configuration to a variable primary configuration. Taking advantage of the central plant’s recent retrofit permitted the use of chiller and pump connections provided for future capacity expansion and a common return header to accomplish the conversion at minimal cost.
Collectively, a plan was devised for the university to self-perform the installation of a 20-ft section of 14-in. pipe so that at part load, the variable primary could be tested without modifying the main 24-in. headers; by simply opening the pump motor disconnects on the primary chilled water pumps, the “temporary” variable primary system could be tested and validated without any control-strategy modifications. Sufficient 24/7 load was available to meet minimum chiller flow requirements.
Following a six-week testing phase, regression analysis of current and historic data verified that the variable primary concept would reduce operating cost. TWU self-performed permanent removal of primary chilled water pumps by installing short spool pieces.
With an initial continuous energy oversight investment of $62,000 (including the annual consultative service fee), TWU reduced the operating cost of the plant by $74,061 by the end of 2010, achieving a simple payback of just 14 months. Over time, as performance history was established, other deficiencies were identified and control strategies modified to rectify these deficiencies. The impact on these subtle changes could be seen immediately. From January through November 2011, accrued savings surpassed $95,000, with projected annual savings of $53,000 from future operational and/or capital improvements. Since the implementation of the utiliVisor service, TWU has now cumulative savings of $166,635.
To bend the axiom, “If you measure chiller plant operations continuously and knowledgeably, you can manage them cost-effectively.” Continuous energy monitoring, system optimization, and verification pays off in significant energy savings. ES
Looking for a reprint of this article?
From high-res PDFs to custom plaques, order your copy today!


