Calculating Life-Cycle Cost
Detailed calculations can unearth hidden savings.
Most consumers have an intuitive sense of TCO. Because of perceived greater reliability, many will pay a premium up front for a certain brand of car or truck. On the flip side, the Yugo was an abject failure in the marketplace despite its alluringly low upfront cost.
But in the business world, an intuitive sense of TCO isn’t enough, as hard data is often needed to justify higher upfront purchase costs. Detailed TCO calculations take into account not only upfront costs but also costs for maintenance, operation, and disposal. This article will show how to acquire the information that goes into TCO calculations and how to use this information to calculate TCO data using off-the-shelf software.
DEFINING THE PROBLEM
Before TCO can be discussed in detail and calculated, it’s necessary to define commonly used terms.
• Life-cycle cost (LCC) – The cost of using an item in its intended application over the entire time period of expected use. LCC typically takes into account lost production and corrective maintenance cost.
• Total cost of acquisition (TCA) – All the costs associated with buying goods, services, or assets.
• Total cost of ownership (TCO) – LCC + TCA + operating cost + disposal cost.
Mean time between failure (MTBF) = MTBF describes the expected time between two consecutive failures for a repairable system, and it’s the inverse of the failure rate of the device. MTBF can also be described as the ratio of the cumulative operating time to the number of repairable failures for that item over the time that the failure rate is stabilized.
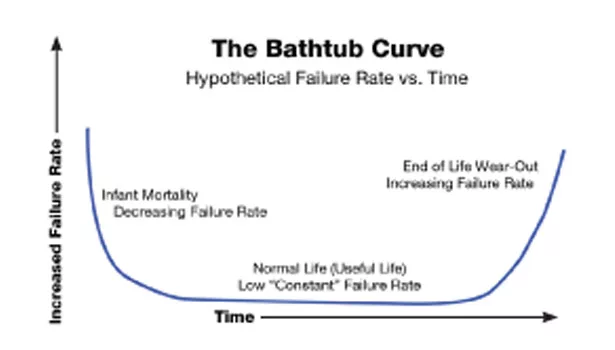
MBTF must be determined based on a period of time when the failure rate has stabilized. In practice, this means eliminating failures due to the initial infant mortality and final wear-out portions of the bathtub failure rate curve (Figure 1). This stabilized failure rate is sometimes referred to as an exponentially distributed failure rate.
Using these definitions, it can be deduced that TCO is summation of LCC, TCA, operating cost, and disposal cost. MTBF enters the picture as a factor in calculating LCC because it can be inferred that the greater the MTBF, the lower the LCC. This article will concentrate on the LCC portion of the TCO.
SOFTWARE SIMPLIFIES CALCULATIONS
There are a number of quality off-the-shelf software programs from such companies as Isograph, Reliass, and ReliaSoft, that can be used to simplify complex LCC calculations. Our example will use ReliaSoft’s Weibull software, which can compute MTBF and LCC based on actual field or estimated data.
To obtain the most accurate results, there’s no substitute for reliable field failure data. But in many cases, this data isn’t available, particularly for perspective new components and applications. In lieu of actual field data, most vendors can provide design-based MTBF data.
While vendor MTBF data is helpful, it must be used with caution as it doesn’t take into account actual planned operating conditions. For example, applying a component in a very harsh environment can substantially increase failure rates. Failure to maintain an item in accordance with vendor recommendations can also increase failure rates.
Using either actual field or vendor data, the total MTBF of a system can be calculated using the MTBF for each individual component. These calculations must also take into account component interactions that could affect MTBF, as well as operating conditions. Once the system MTBF value is computed, the next step is to model the application.
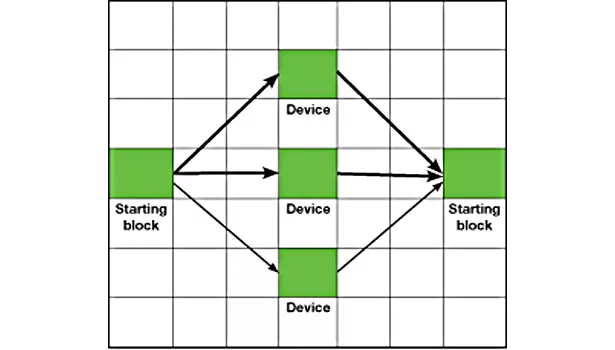
Reliasoft offers a tool called BlockSim that can be used to simulate a system from a reliability perspective. Each component in the system is represented by a block, and the blocks are linked together to form a system (Figure 2).
For simple systems where each component’s failure rate is independent of the other, the modeling is fairly straightforward. For a device to be considered independent, its failure cannot affect operation of another device.
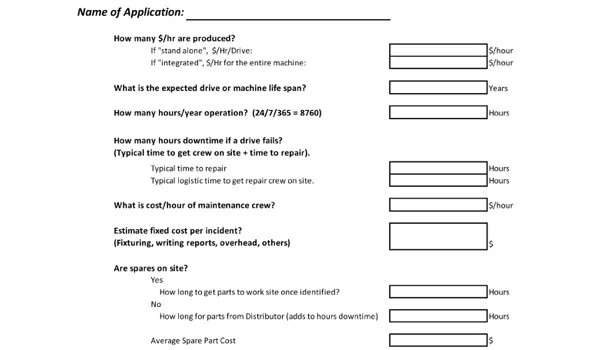
Once the block diagram is created, the next step is to enter application and maintenance data into the software (Figure 3). This data will allow the software to generate a more complete analysis of LCC.
IN THE REAL WORLD
Our discussions up to now have dealt in theory, but an HVAC fan application will be used to show how theory is applied to a real-world application.
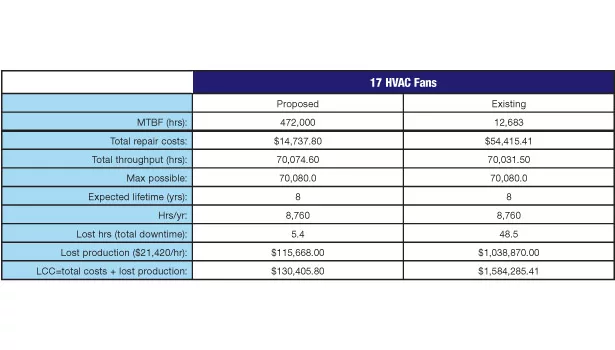
In this application, 17 VFDs are used on fans in the HVAC system for a large building. Actual field data is used for the existing VFDs. For the proposed VFDs being considered as a replacement for the installed VFDs, the MTBF is based on field data for different but similar commercial applications. The purpose of this exercise is to compare the expected LCCs of the existing and proposed new VFDs.
As shown in Table 1, the cost of lost production is nearly double the cost associated with repair of failed components. It’s also obvious from the LCC calculation that the proposed changeover to the new VFDs will yield substantial savings over the life of the system.
The total acquisition cost for the new VFDs plus the installation cost was substantially less than the LCC savings, so in this particular case the system owner decided to proceed with the upgrade. The LCC calculations were a critical factor used to justify the purchase decision, and to calculate expected return on investment.
CONCLUSION
The true cost of any component or system is often more dependent on operating and repair costs as opposed to up front purchase prices. To determine this true cost, information such as failure rates, MTBFs, repair costs, and lost production must be taken into account. ES
Looking for a reprint of this article?
From high-res PDFs to custom plaques, order your copy today!


