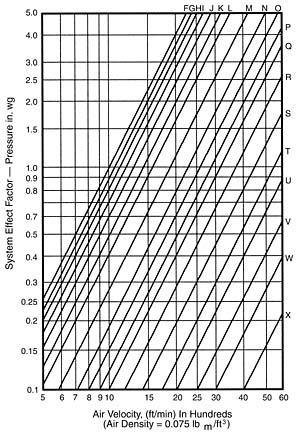
As an approach to quantifying this effect, the Air Movement and Control Association (AMCA) developed the concept of the “system effect factor.” Figure 1 includes a family of system effect curves. By entering the chart at the appropriate inlet or outlet velocity on the abscissa, locating the appropriate system effect curve, and reading across to the ordinate, an equivalent pressure loss is obtained for the particular configuration and velocity. This system effect factor is given in inches of water gauge (in. wg) and must be added to the estimated total system pressure losses. Where there will be a “system effect” at the outlet and the inlet, the appropriate factor must be determined separately for each configuration and both must be added to the estimated total system pressure losses.
Elbows Near The Fan Outlet
Space requirements often result in a system being designed with elbows at, or near to, the fan outlet. Published values for pressure losses in elbows are based on the assumption of a uniform velocity profile entering the elbow, but the velocity profile at the outlet of a fan is not uniform and an elbow located at or near the outlet will develop a pressure loss which will be significantly larger than the published handbook value.The complexity of developing appropriate system effect factors will be demonstrated when it is appreciated that AMCA data include more than 100 combinations of blast area/outlet area ratio, outlet duct length, and elbow position.
For certain elbow positions, an additional multiplier must be used when considering double inlet fans. This results in 224 factors, which can be applied to a simple duct elbow in the outlet duct.

Fan Outlet Conditions
The rating test of a centrifugal fan is normally performed with two to three diameters of duct on the fan discharge. Catalog data would indicate, “Performance shown is for fans with outlet duct.”Figure 2 shows the controlled diffusion necessary to establish a uniform velocity profile in a duct downstream of a centrifugal fan. If the fan is installed without a similar discharge duct, the fan will not develop its maximum performance.
This “loss” (apparent) of fan performance, due to the effect of deficient system connections, is the outlet “system effect.”
Fan Inlet Conditions
The inlet of a fan is even more sensitive to the effect of the system connections than the outlet. Some fans intended primarily for use as “exhausters” may be tested with an inlet duct in place or with a special bell-mouthed inlet to simulate the effect of a duct. If this condition does not exist in the final installation, there will be a loss due to the forming of avena contractaand the following rapid expansion, and a system effect factor must be applied.Elbows at or near the fan inlet will produce non-uniform inlet flow and in many cases will generate an inlet vortex; the swirl or spin in the vortex may rotate in the same direction as the fan impeller or it may be opposed. In either case, the effect on fan/system performance can be very significant.
Reductions of airflow of as much as 45 percent have been observed in particularly bad cases. Inlet configurations that generate swirl should be avoided where possible. In many cases, losses can be reduced by the use of turning vanes.
In large, built-up systems it is common to enclose one or more centrifugal fans in a plenum or cabinet. Unless the wall to inlet clearance is equal to at least one inlet diameter, some allowance must be made for the system effect of the plenum walls.
Attention must also be given to the path that the airstream follows in approaching the fan inlets. If this is such that the airstream enters the inlet unevenly or if spin is generated, loss of performance will result. If it is not practical to alter the flow pattern ahead of the inlet, some improvement can usually be obtained by the use of baffles at the fan inlet.
A reduction in fan performance can also be expected when an obstruction to airflow is located in the plane of the fan inlet. Structural members, columns, butterfly valves, blast gates, and pipes are examples of inlet obstructions.

Top Horizontal Fan
Use System Effect Curve N-O
Loss from Figure 1 = 0.95 in. wg
TP = 3.0 + 0.95 = 3.95 in. wg
Comparison = 3.95/3 = 132% of the system requirement
Example Application
The following example demonstrates the range of performance variation possible with different fan discharge configurations. (See “Requirements For The Example Application” below.) The effects of elbows are included to show how important their placement is to the performance of the system. Fan inlet conditions have not been addressed.The system effect curve to be used was taken from AMCA Publication 201, Fans and Systems. Configurations 1, 2, and 3 show the progressive improvement of fan performance due to the increased length of duct on the fan discharge. (See Figure 3.)

Top Horizontal Fan
Use System Effect Curve P-Q
Loss from Figure 1 = 0.28 in. wg
TP = 3.0 + 0.28 = 3.28 in. wg
Comparison = 3.28/3 = 109% of the system requirement
To help minimize the losses, other approaches should be considered. The simple expedient of turning the fan upside down reduces system effect losses appreciably. (See configuration 4 in Figure 3.) Compare the 0.56 in. wg system effect loss of configuration 4 with the 0.95 in. wg system effect loss of configuration 1. This substantial reduction in the loss was accomplished with a minor change in the installation.

Top Horizontal Fan
No System Effect Factor
Loss = 0
TP = 3.0 + 0 = 3.0 in. wg = 100% of the system requirement
Reduction in the total power required depends on the total pressure requirements of the system. In the two examples cited, a comparison of the total pressures is:
Configuration 1 – TP = 3.95 in. wg
Configuration 4 – TP = 3.56 in. wg

Bottom Horizontal Fan
Use System Effect Curve Q
Loss from Figure 1 = 0.56 in. wg
TP = 3.0 + 0.56 = 3.56 in. wg
Comparison = 3.56/3 = 119% of the system requirement
Figure 3. Configurations 1, 2, and 3 above show the progressive improvement of fan performance due to the increased length of duct on the fan discharge. Configuration 4 shows the results when turning the fan upside down.
Today’s energy costs demand not only the best fan for the job, but the best installation as well. Configuration 5 is the best installation for this example. This installation not only eliminates the need for a system effect loss, but it eliminates the pressure drop across the first elbow in the system. Note the 102 inches of duct on the fan discharge to avoid potential system effect losses downstream of the fan in its new location.
Time spent in an analysis of system effect will be a rewarding investment. AMCA Publication 201, Fans and Systems, presents an analysis of system effect for the designer to take into account in the design of a system. An optimum system design provides the client with long-range energy savings while helping to maintain the profit in a job.

Upblast Fan
No System Effect Factor
Plus
Elbow Pressure Drop Is Eliminated
Figure 4. Configuration 5 is an upblast fan.
System Requirements
Flow rate = 22,000 cfm
Total pressure (TP) = 3.0 in. wg (includes the pressure loss for the elbow shown in configurations 1, 2, 3, and 4.)
Fan Selection
Forward-curved 30 x 30 DWDI
Flow rate = 22,000 cfm
Outlet area = 9.31 sq. ft. (AMCA recommended maximum)
Equivalent duct dia. = 41 in. (calculate from area)
2-1/2 Duct dia. = 102 in. (Figure 2)
Discharge velocity = 2,360 fpm (22,000/9.31)
Velocity pressure (VP) = 0.35 in. wg
Fan static pressure (SP) = 2.65 in. wg (3.0 TP – 0.35 VP)
Blast area = 60% (from manufacturer)
This article was prepared by the Air Movement and Control Association International Inc. (AMCA). For more information, visit www.amca.org.
Publication date: 05/12/2003

Report Abusive Comment