Often the impact of cost increases on profitability can be fully discerned only in hindsight. As contractors examine their books to find out if sales volumes reached expectations and determine if increases in insurance costs necessitate an increase in service rates next year, they might wonder how others in the industry have been faring.
The News’ “Salary and Service Rates Editorial Study” was conducted in 1999, 2000, and 2002, and the data accumulated from the more than 1,600 respondents over this four-year period can help contractors put their own rates and expenses into perspective as they prepare to navigate an uncertain economy in 2003. While looking back at past surveys, The News interviewed several contractors to examine how the recent economic downturn affected their businesses and ask them about the challenges they foresee in the year ahead.
“This has been a roller coaster year,” said Don Vansant of Snellville Heating & Air Inc., Monroe, GA. “The low interest rates have kept the new construction going, and a fairly warm summer has helped out the replacement market. The only real decline we have seen is the larger spec homes ($1 million and more) seem to not be selling.
“We will finish out the year about the same as last year. We are well below our projected budget, but are happy to have been able to hold our own.”

SALES VOLUME
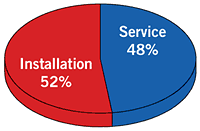
In the past three surveys, the numbers have been consistent in response to questions asking how much of the company’s sales volume was derived from installation work and how much from service.Respondents to the 1999 survey stated that installation accounted for 54% of sales, while service accounted for 46%. In 2000, sales volumes averaged 52% installation, 48% service. The numbers from the 2002 survey are identical to those in 2000. (See Figure 1.)
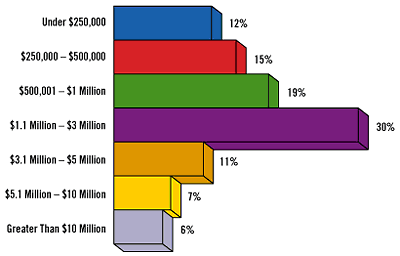
In the 2002 survey, 46% of respondents reported total annual sales volumes of $1 million or less, while 54% reported annual sales of $1.1 million or more. (See Figure 2.) The median annual sales volume of those responding was $1,250,000, and the mean figure was $4,353,173.
More respondents surpassed the $1 million mark in annual sales in each successive year of the survey. In 1999, 45% of respondents reported annual sales volumes of $1.1 million or more. In 2000, 51% reported annual sales of $1.1 million or more, compared to 54% in 2002. On average, respondents reported higher average sales volumes each year, but 2001 did provide a bump in the road for at least some businesses, according to contractors interviewed by The News.
Skip Snyder of the Snyder Co. Inc., Upper Darby, PA, felt the effects. “Last year was a disaster,” he said. “Sales were off 20% and profits were down dramatically. In fact, we struggled to break even. We are mostly a service contractor and to have a 20% drop in sales is very unusual.
“I believe it’s a combination of a recessionary economy, 9/11, delayed impact of the March 2000 stock market loss, and the sale of several manufacturers that we have a close working relationship with.
“When the manufacturers were sold, their shipping dates became impossible, the lines of communication were disrupted and general confusion reigned. Things are just now starting to get better.”

SALARIES AND BENEFITS
In 1999, 10% of respondents said they had service technicians earning annual wages over $50,000. By 2002, the number of respondents paying technicians $50,000 or higher rose to 22%.In 1999, 7% of respondents were paying installers over $50,000. That number rose to 13% of respondents in 2002.
Estimators also experienced a jump in wages. In 1999, 14% of respondents were paying them $50,000 or more. In 2002, 31% of respondents were paying estimators $50,000 or higher.
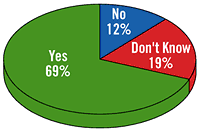
When it came to starting salaries, numbers wavered only slightly between 1999 and 2002 when respondents were asked if entry-level salaries were high enough to attract quality applicants. In 1999, 70% of respondents felt that entry-level salaries were high enough, compared with 68% in 2000 and 69% in 2002. (See Figure 3.)
Mike Stephens of S&S Air Conditioning & Heating Inc., Lewisville, TX, in one of those contractors hoping that better starting wages will attract better people.
“In the coming year, hiring and keeping employees that will provide customers with what they expect every time — without fail — is a priority,” he said.
Benefits are also a key incentive for incoming workers. In 1999, 83% of respondents offered medical insurance to employees. That total jumped to 88% in 2000, and held there in 2002. In 1999, 46% of respondents said they offered employees a pension plan as a benefit, while 29% offered profit sharing. By 2002, only 15% were offering a pension plan, while 26% indicated profit sharing was available.
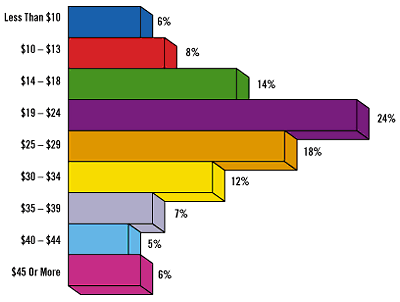
While benefits such as pension and profit sharing were on the decline from 1999 to 2002, employee labor expenses were on the rise. In 1999, when asked to figure their average payroll labor expenses (including fringe benefits) per technician per hour, 21% of respondents said their average payroll labor expense exceeded $30 per hour. In the 2000 survey, the percentage jumped to 26%, and in 2002, 30% cited payroll labor expenses of over $30 per technician per hour. (See Figure 4.)

PRICING STRUCTURES, SERVICE RATES
The percentage of contractors using a flat-rate pricing structure has changed very little over the last four years, according to recent surveys. In 1999, 32% of those responding indicated that they used flat rate, compared with 31% in 2000 and 33% in 2002.Those who charge by the hour have demonstrated a steady increase in charge-out service rates over the same period. In 1999, 22% of respondents to the survey charged more than $60 per hour, compared to 41% in 2000. In 2002, 66% of respondents indicated that they charge $60 per hour or more, including 2% who charge $100 or more per hour.

LOOKING AHEAD
Contractors interviewed byThe Newshad some insights on the challenges they expect to see in 2003.“I honestly see the biggest challenge is the same old challenge — people,” said Kevin Sharkey of Forward Electric & Air Conditioning, Stuart, FL. “Our industry, like many others, has a big qualified employee shortage. Today consumers are demanding more and more personal services, which in turn creates a demand for a larger trained workforce.
“The problem is that the very same consumers/schools told their children not to go into the service fields. Look around at your service providers, count the young fresh faces compared to those that came back out of retirement. The retirees win hands down. Soon they will be gone and the problem will be worse.”
Snyder was very explicit in the obstacles he sees that could make business more difficult in 2003. He listed the following trends:
Taylor chose to look at the bright side. “We are optimistic for 2003,” he said as he looked back on the events following Sept. 11, 2001.
“We know that there are going to be ups and downs in the business that we are in, but we never realized that there was a big pothole looming on the down side that would take out all four of our tires at once. We have gotten our flat tires fixed and we are taking the advice of Todd M. Beamer from flight No. 93 in Pennsylvania — ‘Are you guys ready? Let’s roll!’”
For information on obtaining a complete copy of the “2002 Salary and Service Rates Editorial Study,” visit www.achrnews.com (website) and click on “Market Research.”
Publication date: 12/23/2002

Report Abusive Comment