First, the good news: Those techs earning between $45,000 and $54,999 jumped from 21 percent in 2005 to 30 percent in 2007. Now, the bad news: Those techs earning in the $35,000-$44,999 salary range dropped from 42 percent three years ago to 34 percent in 2007.
These are just some of the facts revealed in ACCA’s recently released “2007 HVAC Labor & Payroll Expense Survey.” The report is provided as a service to contractor members of ACCA and is available for purchase.
“These surveys are designed to seek out information on labor overhead and allow ACCA members to compare the costs of their own employees’ salaries and service rate charges derived from labor expenses against those of other members having their same geographical location, company size, and other common denominations,” it states in the report’s introduction. “Our goal in these surveys is to give our members a basic benchmark to gauge their own expenses against other contractors and use these results to some constructive manner to assess their operations and payroll expense lines.”
A total of 300 contracting businesses completed the 2007 survey. Among the items asked for included geographic market location, primary market served, primary source of sales volume, breakdown of technical workforce (be it a union or non-union shop), annual sales volume, and average number of technicians employed during the course of an average year.
What most contractors zero in on, however, are the salaries.

Chart A. (Click on the chart for an enlarged view.)
SALARIES FOR TECHS, INSTALLERS, AND MORE
As far as the 2007 report is concerned, the base salary for technicians remained relatively stable in comparison with 2005. Though there was a 6 percent drop (from 26 percent in 2005 to 20 percent in 2007) in the $25,000-$34,999 range and an 8 percent drop (from 42 percent to 34 percent) in the $35,000-$44,999 range, there were jumps in salaries - from $45,000 and upward - for technicians on an annual basis.As noted above, there was a 9 percent increase (jumping from 21 percent in 2005 to 30 percent in 2007) in the $45,000-$54,999 range. Plus, there was a 3 percent increase (from 8 to 11 percent) in the $55,000-$64,999 range, a 1 percent increase (from 1 percent to 2 percent) in the $65,000-$74,999 range, and a 1 percent increase (from 0 percent to 1 percent) in the $75,000-and-up salary range.
“The increase in base salary for technicians can be attributed to the national rise in cost of living, service rates, and disposable income,” it states in the report.
The same salary rollercoaster ride applies to wages paid to installers. While there was a 9 percent drop (falling from 43 percent to 34 percent) in the $25,000-$34,999 salary range for installers, there was an 8 percent increase (jumping from 11 percent to 19 percent) in the $45,000-$54,999 salary range. Most of the other salary ranges stayed the same (3 percent for $55,000-$64,999 range and 1 percent in the $65,000-$74,999 range). The final tally was a 1 percent increase (jumping from 0 percent to 1 percent) in the $75,000-and-up category.
The 2007 report also provides base salaries for estimators, service managers, sales managers, operations managers, vice presidents/general managers, spouses of the presidents/owners, and presidents/owners. The largest percentage (19 percent) of estimators receive a salary in the $55,000-$64,999 range. Meanwhile, 29 percent - the largest percentage - of service managers earn in the $45,000-$54,999 salary range. Going down the list:
•Sales manager- Twenty-two percent (largest percentage) earn in the $55,000-$64,999 salary range. (Special note: There was a 7 percent increase (from 7 percent in 2005 to 14 percent in 2007) for those sales managers earning $75,000-$84,999.)
•Operations manager- Seventeen percent earn in the $35,000-$44,999 salary range, while the same percentage earn in the $45,000-$54,999 range.
•Vice president/general manager- Standing out, there was a 10 percent decrease (dropping from 16 percent in 2005 to 6 percent in 2007) in the $55,000-$64,999 range, but this resulted in a 6 percent increase in both the $75,000-$84,999 salary range and the $95,000-and-up salary range for vice presidents/general managers for 2007.
•Spouse of president/owner- Highest percentage (48 percent) are in the $34,999-and-below salary range. Eleven percent (up from 9 percent in 2005) are in the $85,000-and-up salary range.
•President/owner- As in 2005, 40 percent (highest percentage) earn in the $74,999-and-below salary range for 2007. There was a 4 percent increase (jumping from 20 percent in 2005 to 24 percent in 2007) in the $125,000-and-up salary category.
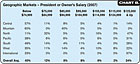
Chart B. (Click on the chart for an enlarged view.)
REGARDING SERVICE RATES AND TOTAL EXPENSES
As would be expected, service rates have risen in the past two years, correlating with the cost of doing business and labor expense for the average contracting company. According to the latest ACCA poll, 31 percent of those contractors surveyed charge $100 or more for a basic charge-out only. The next highest percentage (23 percent) charge between $70 and $79 per hour.At the same time, the average payroll labor expense - per technician per hour including fringes – continues to rise also. The biggest leap was in the $40-$49 range, increasing from 13 percent in 2005 to 16 percent in 2007.
In the big picture, there was not a significant shift in percentages from 2005 to 2007 in the “percentage of total overhead expense-administrative” category, which includes office, sales, and managerial expenses. The 11 percent to 15 percent range was the highest percentage (20 percent) in that category for those surveyed in the 2007 poll.
On the other side of the salary coin, overall the percentages in the “percentage of total overhead expenses – field operations” heading - which includes operations managers, technicians, estimators, and installers - show a slight increase in 2007 from 2005. The highest percentage was 16 percent, in the 50 percent-and-over niche.
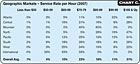
Chart C. (Click on the chart for an enlarged view.)
GEOGRAPHICALLY SPEAKING...
As in the previous surveys, ACCA’s 2007 report broke down the stats via demographics. In most instances, the survey results indicate that technician salaries for the Atlantic, Pacific, and North were above average in all ranges at the higher end of the scale.Conversely, those of the South are below the national averages on the higher end of the scale and above those on the lower end of the salary scale, “likely attributable to the lower cost of living in that region.”
Results from those surveyed from the Mountain region indicate salaries much higher in the mid-range but lower on the lower and upper ends of the scale. Those who reported from the Central and West regions were on par with the national averages overall, with slight deviations across the board. (See chart A.)
Breaking down the president/owner’s salary figures, over 50 percent of those surveyed report that they (or their employer) are paid $85,000 or less, with 40 percent at under $75,000. It is apparent from those surveyed that the presidents or owners in the Mountain region are lower than those surveyed elsewhere in the country, and the Atlantic and North region top earners exceed overall averages at the high end of the scale. (See chart B.)
Examining the “service rate per hour” category, survey respondents from the Atlantic and North regions indicate a much higher than average service rate than other regions in the $100-and-up range. At the same time, respondents from the Mountain region indicated that 100 percent of their average rate falls between $70 and $89. (See chart C.)
Included in the 2007 survey is a breakdown of payroll labor expenses for all regions. The payroll expenses for the North are much above the average payroll labor expense rates on the higher end of the scale. The rates for the Mountain region - and, to some extent, the South and West regions - are above average on the lower end of the scale.
As the report concludes, “Accurately forecasting the cost of conducting business and bidding on future projects is vital to the survival of any business. And, with your labor expense as a major component of this process, keeping up with current trends in expenses and salaries for your employees, as well as applying those payroll costs to the rates you charge your customers, can be a monumental task.”
To purchase, the “2007 HVAC Labor & Payroll Expense Survey,” contact ACCA headquarters at 703-575-4477.
Publication date:02/04/2008

Report Abusive Comment