Data loggers and the subsequent analysis of thousands of points of data can also be a huge waste of time if improperly applied. There are standard procedures and techniques that can help assure that the data logging tools are used for maximum effectiveness.
This article focuses on stand-alone data loggers in conjunction with the logging capabilities of the BAS in the context of use by a commissioning provider. It also provides tips and advice on specific procedures and techniques that will enable the efficient and effective use of data loggers to analyze building performance.
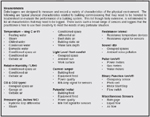
Measurements. (Click on the chart for an enlarged view.)
DATA LOGGING APPLICATIONS
Two of the most common reasons for using data logging in building commissioning is to demonstrate performance or for system troubleshooting. The following are some common performance demonstration and troubleshooting scenarios.Performance
• Log occupied space environmental parameters (temperature, rh, CO2, lighting, noise) to demonstrate that the facility meets the contract requirements for the purposes of acceptance. This is generally straightforward; the system either meets the requirements or it does not.
• Log occupied space environmental parameters to demonstrate to an occupant that their environment meets standards. This can be more complicated, as even faced with hard data, some people will feel that the space is not adequate.
• Log overall building or specific system energy use to prove energy savings in support of a utility funded project, therefore receiving grants or funding. In this case it is critical to have a highly accurate approach as considerable money can be involved.
• Energy use logging to support a Monitoring & Verification Plan to qualify for a USGBC LEED point.
Troubleshooting
• Logging occupied spaces and system parameters to evaluate why a space is having (confirmed) environmental control problems.
• Log space temperature at various distances from the ceiling to evaluate stratification and short-circuiting problems.
• Log duct static pressure, hydronic loop differential pressure or HVAC unit discharge temperature to evaluate and adjust system loop tuning and response.
• Log building static pressure and various HVAC equipment parameters to evaluate why the building static pressure fluctuates all the time to the point of slamming doors or blowing them open.
• Log economizer damper positions and various HVAC temperatures and parameters to evaluate causes for high energy use, occupant comfort problems, or other problems.
• Log economizers to verify warm-up period and optimum start/stop functions.
• Log system and component start/stop times to verify scheduling.
• Log lighting controls for conformance to schedule, light levels, and occupancy.
• Log heating and chilled water plant parameters to evaluate causes of high energy use and poor performance.
DATA LOGGER OPERATION
There are a wide variety of data logging devices available and the exact operation of each cannot be covered here. There are certain steps that will be required regardless of the particular unit and they are as follows:• Planning
• Configuration
• Deployment
• Recovery
• Analysis and Reporting
Planning:
As with any endeavor, careful planning will be the difference between a successful logging project and one that requires excessive data manipulation at the end or in some cases that has to be done over.
If data logging is being undertaken then there is some goal to be achieved. A Data Logging Plan (DLP) should be developed outlining the goals and approach. As with most projects, it is important to start with the end in mind. The DLP should outline the specific goals to be achieved or a problem statement outlining the circumstances requiring troubleshooting and hence data logging and reporting. The following is an outline for the DLP.
• Goals and/or Problem Statement including reporting requirements (charts, graphs, etc.)
• List of the BAS trend logging capabilities
• List of environmental parameters that are to be measured including what BAS trend logging points are to be used and what stand-alone data loggers are to be used
• Accuracy/calibration requirements for all logged points
• Sample interval for all logged points
• Sensor location for all logged points including any special fixtures required
• Logging period (start/stop date/time) - Identify if there will be some event during that period that is critical to capture
• Communication Plan: intent, impact, and duration of study with building owner, facility staff, or occupants
Configuration:
The Data Logging Plan will outline the various parameters for the logging project. All stand-alone data loggers and all BAS trend log systems must be configured prior to deployment or starting of trending. The configuration phase typically will include the following steps.
• Define Points
• Sensor Calibration
• Set Sample Interval
• Set Sample Size
• Set Sample Overrun Option
• Set Start Method
• Synchronize Clocks
• Assign File Name
• Trial Run
Define Points:The BAS and the stand-alone data logger may or may not have the needed points defined. In both cases, the individual points need to be activated or turned on. The input type, sensor range, and other parameters must be set specific to each sensor type. This is a critical operation and care should be taken to use the correct point definition for the associated sensor. Many of the sensor definitions appear very similar and selecting the wrong one will result in significant data errors. During this step, it is important to use consistent naming conventions so that the data makes sense later. Often, the names used in the point definitions are the column headings in the data fields and eventually will be used in graphical representations. Careful planning at this stage will reduce the amount of manipulation later when graphs are developed for the report.
Sensor Calibration:If the project is a critical application the sensors should be calibrated. The calibration should include the sensor and recording device as configured. Changes in wire lengths and other variations may invalidate the calibration. Even if calibration is not required, the calibration should be checked to ensure relative accuracy. Calibration or calibration checks are done by subjecting the sensor to a known standard environment such as an ice bath or calibrated immersion bath.

Table 1. Data misalignment due to staggered sample intervals.
(Click on the table for an enlarged view.)
Some stand-alone loggers and most BAS trend loggers have a feature that uses change-of-state or limits to determine when a data point is logged rather than at a set interval. The change-of-state feature is used on binary points such as motor start/stop. The limits feature logs analog points only when a certain limit is reached. Both are designed to reduce the amount of samples taken, conserve memory, and to capture specific events. Both will result in data being recorded at arbitrary times that does not line up with the data logged on intervals. The change-of-state feature has also been known to cause some BAS logging systems to malfunction and cause data corruption throughout the entire logging system. These features should only be used in special cases when an exact event needs to be logged.
Because systems now have such large sampling capacities, it is practical to set all logging intervals to the same value equal to the least common denominator. This way, all data lines up and requires minimal manipulation and smoother data. One downside to this approach is large data files, which can be unwieldy if they are later manipulated in third party software such as MS Excel. But the efficiencies gained typically outweigh this problem, and after all, memory is cheap. The following table contains some suggested intervals for various typical commissioning logging activities. Remember, the logging intervals for both the BAS and the stand-alone loggers should be set the same if the data from these two systems are to be combined later in the analysis.

Table 2. Suggested intervals for various parameters. (Click on
the table for an enlarged view.)
If different sampling intervals are to be used, they should be common multiples so the data has voids, but lines up. For example: 2 minutes and 10 minutes, 5 minutes and 30 minutes to achieve short and long intervals.
Set Sample Size:In most BAS trend logging systems sample size is an option. This is important because system memory is used for operation of the control system as well as trend logging so memory conservation is an issue. In stand-alone data loggers, the maximum size is typically automatically calculated based on the internal memory size, the number of activated channels, and the logging interval. Setting the sample size will determine how long the data logging period will be. For example if the logging interval is 1 hour for a single channel, then a sample size of 48 will get two full days of logging.
Set Sample Overrun Options:When the data logger memory is full, there are two options: overwrite the oldest data or stop logging. The first choice is generally used when a particular event that is to be logged is not predictable. The most recent data is always in memory so the user can stop the process after some event significant to the logging plan has occurred. The second choice of stopping the logging when the memory is full is useful when the exact logging period is known beforehand.
Set Starting Method:There are typically several options for starting the beginning of the logging period: instantly after configuration, at a pre-determined time, event logging, and via a manual input (push button). Set the appropriate method for the application. The best option to maintain uniform data integration is starting at a pre-defined time. In this way, the data from all stand-alone loggers will be in synch with each other and the BAS trend logger if properly set up. In some loggers a stop time may also be an option to set.
Synchronize Clocks:There are three areas of clock synchronization: the stand-alone logger clock(s), the BAS trend logger clock, and the user’s timepiece. The user’s timepiece should agree with the other system clocks so the time will agree with the deployment records. Most stand-alone data loggers will use the system clock of the computer that launches them so this clock should be set prior to downloading the setup to the logger. BAS systems can have more than one clock to consider. The BAS graphical user interface computer has a clock and so does the main BAS controller. Some BAS systems use the PC while others use the controller clock. Be sure to be clear on what clock is being used to record the trend data.
Assign File Name:Depending on the system, a file name may be entered to describe the logging activity. Like defining the sensor channel names, using a compact yet descriptive file name can simplify organization activities later.
Download Configuration:Once all configuration parameters are set, the configuration is downloaded to the data logger. Typically a BAS trend logger does not require this step, though there may be some that require a similar step.
Trial Run:It is always advisable to perform a trial run to ensure that the data is being recorded as intended and can be recovered in a usable format.
Deployment:
Once the data loggers are configured, the stand-alone data loggers need to be deployed into the environment to be evaluated. The following outlines the deployment process.
• Position Loggers and Sensors
• Record Logger Deployment Information
• Verify BAS Trending
• Activate Logger
Position Loggers and Sensors:Position the standalone data loggers and sensors per the Data Logging Plan. Consideration should be given to who might be in the area that may interfere with the devices. It is advisable to notify the occupants if logging activities are to occur in occupied spaces. It is also a good idea to leave a business card with the devices. Protect loggers from any environmental conditions it was not designed for. Sensor wires and logging devices should be secured using screws, clamps, magnets, tie strips, tape, etc. Care should be taken to ensure that the sensor wires do not become disconnected from the sensors or data logger; make a final check before leaving installation.

Table 3. Data logger deployment information sheet. (Click on the
table for an enlarged view.)
Verify BAS Trending:Check the BAS system and verify that the trends are active. Observing the trends in real time will typically not affect the BAS trend files.
Activate Logger:If the logger was activated at download or the pre-determined start time option is set, then this step is not required. For push-button types activate the logger manually. In all cases, verify that the data record indicator indicates that the unit is recording. Record the start time and any other pertinent information on the Data Logger Deployment Information Sheet.
Recovery:
At the end of the data logging period, the stand-alone loggers are retrieved and the data is recovered from the BAS trend logs and the stand-alone loggers. The following are the steps for the recovery process:
• Data Logger Upload
• Data Logger Retrieval
• BAS Trend Upload
• Backup Data
Data Logger Upload:Prior to removing the sensors, the data should be uploaded from the logger in the unfortunate event that there was a logger malfunction and the logging session needs to be repeated.
Data Logger Retrieval:Once the data integrity is verified, the loggers and sensors can be picked up and stored.
BAS Trend Upload:If BAS trend logging is part of the Data Logging Plan, the trend logs are recovered from the BAS system. Some BAS systems have the capability to be used for data analysis and reporting, but in most cases the data will be recovered and combined with the stand-alone logger data during the Analysis Phase. Most BAS systems are capable of exporting data files that can be imported by the stand-alone logger software or a third party tool such as MS Excel. Occasionally some creative tricks must be used to extract the data out of some BAS trend systems.
For example, some BAS logger systems do not have an export function, but the text data can be selected in the text-based report in the trend logging system, then copied and pasted using MS Windows to a text editor. In this case, the column headings are typically not in the data that is copied and pasted. Therefore, the user must record what the columns of data represent for use during the data import phase. Column headings can also be typed directly into the text editor on-site, being sure to use the exact same delimiters (discussed later in Data Analysis).
Backup Data:The logging effort to this point represents a significant investment. Prior to erasing the data off the loggers or before leaving the site, it is recommended that the data be backed up. There are inexpensive portable storage devices that plug into USB ports that work well for the backup and for transferring the data files from the BAS trend logging system.
Analysis and Reporting:
Once all the pertinent data has been recovered and stored, the final step is to analyze the data then produce reports that support the goals of the DLP. There are three basic options for working with the data:
• BAS trending system
• The stand-alone data logging OEM (original equipment manufacturer) software
• A third party software such as MS Excel
BAS trend log system:As has been previously mentioned, some BAS trend log systems have decent graphing and reporting capabilities and others do not. If all that is required is a simple plot of similar logged parameters to demonstrate compliance with standards, then BAS trend log systems with graphing capability can usually get the job done.
If more advanced analysis or reporting is required, then these systems usually fall short. Typically none have the ability to merge data from other applications or logging systems. So if stand-alone data loggers are part of the DLP, then it is likely the data cannot be merged with the BAS data.
A critical issue is that when parameters have large value differences but need to be compared to each other on a graph, the BAS trend log system usually cannot be configured to display correctly. For example, displaying building static pressure (a value around 0.03) along with the relief fan VFD signal (a value as high as 100) results in a plot of the VFD signal and a straight line at zero representing the building static pressure. No analysis can be performed on such a plot. The BAS reporting and graphing outputs typically cannot be annotated to point out important events in the data.
The BAS graphs cannot be easily transferred to an electronic report as the function of displaying the graphs resides in the BAS software and cannot be duplicated away from the BAS operator station. One way to get around this is to take screen captures of the graphs, then paste them into an electronic media such as MS Paint where they can be annotated and saved as an image file. This gets the job done but is cumbersome and the graphs cannot be revised to emphasize different issues later.
OEM Software:Some OEM software is fairly limited while others contain extensive features for data analysis. This paper cannot delve into all the capabilities available (or disadvantages) of using the software from various providers, but in general if the software can perform most of the functions outlined under MS Excel below then it would be the application of choice.
MS Excel:MS Excel is a spreadsheet application with extensive reporting and graphing capabilities. With the spreadsheet functions, there is no limit to the operations that can be performed on the logged data including merging data, scaling data to engineering units, and cleaning up bad data. The main disadvantage of using MS Excel is that it takes a few extra steps to bring data into the system then manipulate it. So if the project does not require the power and flexibility that MS Excel can provide, then it is most likely better to use the BAS trend logger system or the OEM software.

Figure D. BAS and stand-alone data comparison – zone temperature
control. (Click on the figure for an enlarged view.)
APPLICATION EXAMPLE: OFFICE OVERHEATING
A two-story office building had recently undergone a complete HVAC retrofit. The system was a four-pipe fan coil with economizers. Two office spaces were reported as overheating in the afternoon on mild days (60-65° F) while the remainder of the offices in the area controlled fine. The obvious things were checked for first, like leaking heating valves, extra load in the rooms, etc., but these revealed nothing. Stand-alone loggers were set up in the spaces because there was some level of distrust by the occupants that the BAS computer was reporting correctly.Preliminary analysis included setting up stand-alone loggers to monitor the supply air temperature, space temperature at the thermostat, and space temperature near where the occupant sits to evaluate zone control and microclimates. This preliminary analysis did not reveal the problem, but demonstrated that the system was capable of good control and the BAS trend log data could be trusted for further analysis. Figure D is a graph from MS Excel using data collected from both the BAS trend logging system and the stand-alone data loggers. In this case it demonstrated good room temperature control. It also shows how sensor calibrations can be different for the different systems. In this type of analysis, the goal is to find the root cause of the problem and minor disagreements of a couple of degrees are not significant to the analysis. As can be seen, both the BAS and stand-alone data show very stable space control and the absolute value of the space temperature is less of a concern because it is reflective of the user adjustable space set point.
In Figure D, the problem was being caused by two overlapping issues that combined to make the situation worse. The economizer dampers leaked, allowing warmer air to recirculate back resulting in a less effective economizer function. As a side note, the installation did not include damper access doors. If they had, then this would have been checked early in the process.

Figure E. BAS trend data – occupied space overheating. (Click on
the figure for an enlarged view.)
So in conclusion, the occupant had a legitimate complaint and the stand-alone data was not really needed to prove anything to them. The dampers were re-indexed and the sequence of operations was modified to prevent the chilled water system from running unless there is a status proof after several minutes of being commanded on.
Reprinted with permission from the Onset Computer Corp. white paper “Data Logger Essentials for Building Commissioning.”
Publication date:01/07/2008

Report Abusive Comment